We continue to maintain best practices for executive compensationPROXY STATEMENT FOR 2023 ANNUAL MEETING. 43
Executive Compensation Program Overview
Guiding Principles
The Compensation Committee has identified the following guiding principles in overseeing the compensation program for our executives:
|
| | | | |
| | | |
Competitiveness Compensation programs should be designed to target at the 50thregressed 50th percentile plus or minus 15%, of total compensation for comparable executive positions at a customized peer group. | | Pay for Performance Where compensation for an executive is tied to the achievement of financial and strategic goals, actual results that exceed target levels should provide above-target payouts, and results that do not exceed threshold levels should not provide payouts. | |
| | | |
| | | |
Responsibility A significant portion of an executive’s overall compensation should be tied to the achievement of financial performance goals. The portion of an executive’s target total compensation that is incentive based should increase as an executive’s responsibilities increase. | | Stockholder Alignment Executives’ interests are more directly aligned with stockholders’ interests when compensation programs: •Emphasize both short- and long-term financial performanceperformance; •Are significantly impacted by the value of Common StockStock; and •Require meaningful Common Stock ownership. | |
Peer Group Benchmarking and Total Compensation
Each year, the Compensation Committee’s compensation consultant collects peer group compensation data and prepares an executive benchmarking study using a market regression analysis to size-adjust the market data for our net sales size as a whole and for each separate business unit.whole. The Compensation Committee, with input from its independent compensation consultant, reviews the prior year peer group. This review focuses on companies that have a primary manufacturing component to their businesses, have similar organizational structures and are publicly traded or otherwise file financial statements with the SEC. The 20-companyWe believe the resulting peer group approved byprovides a valid and appropriate comparison for the Company’s executive compensation program and governance practices. For fiscal 2022, the Compensation Committee for fiscal 2017did not make any changes to the previous year’s group. (the “PeerThe peer group for fiscal 2022 (“Peer Group”) isconsisted of the companies listed below and is unchanged from the below.fiscal 2016 peer group.
|
| | | | | | | |
Fiscal 20172022 Peer Group |
Ametek, Inc. | IDEX CorporationThe Compensation Committee targets total compensation at or about the regressed 50th percentile of the Peer Group |
| Armstrong World Industries, Inc. | Lennox InternationalHelios Technologies, Inc. |
| Badger Meter, Inc. | Hillenbrand, Inc. |
| Chart Industries | IDEX Corporation |
| Circor International Inc. | Itron, Inc. |
| Crane Co. | Mueller Industries, Inc. |
Briggs & Stratton Corporation | Otter Tail Corporation |
Circor InternationalEnPro Industries, Inc. | Quanex Building Products Corporation |
Crane Co. | RoperESCO Technologies Inc. |
Curtiss-Wright Corporation | Tennant Co.SPX Flow |
Donaldson Company, Inc.Franklin Electric Co. | Valmont Industries, Inc. |
EnPro Industries,Graco Inc. | Watts Water Technologies, Inc. |
Graco Inc.Harsco Corp. | Worthington Industries, Inc.Zurn Elkay Water Solutions Corporation |
The Compensation Committee regularly reviews the target total compensation of each executive and compares it to the total compensation for comparable executive positions in the Peer Group. The Compensation Committee targets total compensation at or about the regressed 50th50th percentile of the Peer Group plus or minus 15% (“targeted 50th percentile range”), subject to individual adjustments based on experience, length of service, individual performance and other factors deemed appropriate by the Compensation Committee.
Compensation Elements
The following table lists our primary elements of compensation. Each element is targeted at or about the 50thregressed 50th percentile for comparable positions in the Peer Group.
|
| | | | | | | | | | | | | | | | | | | | | | | | | | | | | | | | | | | | | | | | | | | | | | | | | | | | | | | | | | | | | | | | | | | | | | | | | | | | | | | | | | | | | | | | | | | | | | |
| Pay Element | Salary | Bonus | | | Options | RSUs | PRSUs |
| Recipients |
| | | | | |
Who Receives
| | | All NEOs ----------------------------------------------------------------------------------------------------------------------------------------> |
| | | | |
When Granted
|
|
|
|
|
|
| | | |
| Period of Grant | Generally reviewed every 12 months | Annually | | | Annually | Annually |
| | | | Annually |
| Form of Delivery | Cash ----------------------------------------------------------> | Equity ---------------------------------------------------------> |
| Cash | | | | | Equity | | |
| | | | | |
|
| Type of Performance |
| Short-term emphasis -------------------------------------> |
| | | | Long-term emphasis --------------------------------------> | |
|
| | | | |
Performance
Measures | — | Mix of financial results and EHS-related operational goals | | | Value of delivered shares based on stock price on date of exercise or lapse | Value of delivered shares based on stock price on vesting dates | Return on Net Assets ("RONA") achievement | Relative total shareholder return ("rTSR") |
| Performance Period / Vesting | Ongoing | 1 year | | | Generally vest annually over 3 years | VestsGenerally vest annually over 3 years | Measured and earned annually and vest at the end of the 3-year award cycles |
| cycle | | | | Vest at the end of the 3-year award cycle |
How Payout
Determined | Predominantly tied to Peer Group data, with an element of Compensation Committee discretion | Predominantly formulaic (based on performance against goals), with an element of Compensation Committee discretion | | | Completion of required service period through each vesting date | Completion of required service period through each vesting date | Formulaic (based on performance against goals); Compensation Committee verifies results |
| for specific performance periods | | | | |
Most Recent Performance Measures | __ | Mix of 90% financial results / 10% EHS-related operational goals | Value of delivered shares basedFormulaic (based on stock price on vesting dates | Improvement in return on net assetsperformance against peers) for specific performance periods |
Salary
The Compensation Committee regularly compares the salary of each executive to the regressed 50th50th percentile of comparable executives in the Peer Group and uses that benchmark as a guide. Salaries for the NEOs are adjusted, as appropriate, annually on February 1. In February 2017, Mr. Hart received an annual salary increase of 3.1%; Mr. Belknap received a salary increase of 3.0%; Mr. Rogowski received a salary increase of 3.0%; and Ms. Zakas received a salary increase of 4.4%. Ms. Zakas also received payments of $5,000 per monthThe Compensation Committee approved the following salaries for assuming interim human resources responsibilities.our NEOs in fiscal 2022. | | | | | | | | | | | | | | |
| Name | Annual Salary Rate at September 30, 2022 ($) | Annual Salary Rate at September 30, 2021 ($) | Salary Increase (%) |
| J. Scott Hall | 854,000 | | 825,000 | | 3.5 | |
| Marietta Edmunds Zakas | 454,564 | | 437,081 | | 4.0 | |
| Steven S. Heinrichs | 459,426 | | 443,890 | | 3.5 |
|
| Todd P. Helms | 372,203 | | 358,750 | | 3.7 | |
| Kenji Takeuchi | 374,920 | | 360,500 | | 4.0 | |
|
| | | | | | | | |
| Name | Annual Salary Rate at September 30, 2017 ($) | Annual Salary Rate at September 30, 2016 ($) |
| Gregory E. Hyland | 1,000,000 | | 900,000 | |
| Scott Hall | 750,000 | | N/A | |
| Evan L. Hart | 418,000 | | 405,300 | |
| Keith L. Belknap | 443,500 | | 430,500 | |
| Gregory E. Rogowski | 446,000 | | 433,000 | |
| Marietta Edmunds Zakas | 357,000 | | 341,900 | |
Annual Cash Incentive Awards
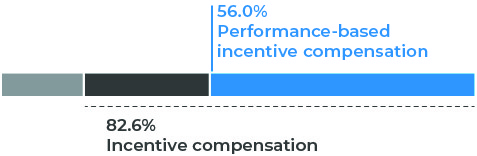
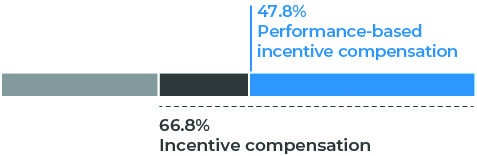
The annual cash incentive plan rewards our named executive officers for achieving key financial metrics, which drive our operating results and enhance stockholder value. The Compensation Committee targets annual cash incentive compensation for each executive at the regressed 50th50th percentile of comparable executives in the Peer Group. For fiscal 2017, the total target opportunity for each NEO was within the targeted 50th percentile range of the Peer Group. Based on actual achieved performance against performance goals, each NEO may earn between 0% and 200% of his or her annual cash target opportunity. For fiscal 2017, each NEO could earn an annual cash incentive award based on achievement against2022, the Compensation Committee selected two types of performance metrics: (i) financial performance goals (weighted 90%) and (ii) EHS-related operational goalsperformance metrics (weighted 10%). ForThe financial performance goals the Compensation Committee determined numeric goals targeting percentage improvements over the prior year’s results. All financial performance and EHS-related operational goals were set with minimum (or threshold), target and maximum objectives for each goal.related to
adjusted EBITDA, adjusted working capital (as a % of Contents
Fiscal 2017 Financialnet sales) and Operational Goals and Results
The Compensation Committee selected financial performance goals for corporate executives based on adjusted income from continuing operations. The Compensation Committee selected this metric to encourage focus on delivering income from continuing operations.
The Compensation Committee selected financial performance goals for Mr. Rogowski based on the Infrastructure segment’s adjusted operating income (defined as operating income, adjusted to exclude certain effects of results of operation’s of newly acquired businesses, pension settlement expenses and other charges), the Infrastructure segment’s adjusted net sales (adjusted to exclude Singer Valve) and adjusted income from continuing operations. The Compensation Committee selected a segment-specific financial performance goal for Mr. Belknap of improvement in adjusted operating income of Technologies and adjusted income from continuing operations.sales. The Compensation Committee selected these performance goals primarilyfinancial metrics to encourage our NEOs to focus on increasing adjusted operating income.
generating income from continuing operations and enhancing long-term stockholder value. The Compensation Committee established operational safety and environmental (“EHS”) objectives applicable to each NEO that wereEHS-related performance metric was tied to reductions in total recordable incidence rates and key performance indicators for sustainability and specific activities identified as leading safety indicators. The EHS objectives for Messrs. Hyland, Hall and Hart and Ms. Zakas were based on company-wide performance. The EHS objectives for Messrs. Rogowski and Belknap were based on Infrastructure and Technologies performance, respectively. The Compensation Committee used adjusted income from continuing operations to determineselected these metrics because they promote, drive and support the availability of a pool from which to pay the operationalCompany’s EHS objectives portion of the incentive award to Messrs. Hyland, Hall, Rogowskiinitiatives and Belknap.
The following table shows the fiscal 2017performance. All financial performance targets and actual results applicable to each NEO.
| Performance Targets and Results |
| | | | | | | | | | | |
| | | | Results Required to Achieve Bonus ($ in millions, except for percentages) | 2017
Actual
Results
($ in millions) | Actual 2017 Payout Factor (% of Target Bonus) unweighted |
| | | Weight (% of Target Bonus) |
| Name | Metric | Threshold (0%) | Target (100%) | Maximum (200%) |
| Gregory E. Hyland | Adjusted Income from Continuing Operations | 90 | 52.7 |
| 65.8 |
| 79.0 |
| 68.5 |
| 120.4 |
| | EHS | 10 | — |
| — |
| — |
| — |
| 128.3 |
| Scott Hall | Adjusted Income from Continuing Operations | 90 | 52.7 |
| 65.8 |
| 79.0 |
| 68.5 |
| 120.4 |
| | EHS | 10 | — |
| — |
| — |
| — |
| 128.3 |
| Evan L. Hart | Adjusted Income from Continuing Operations | 90 | 52.7 |
| 65.8 |
| 79.0 |
| 68.5 |
| 120.4 |
| | EHS | 10 | — |
| — |
| — |
| — |
| 128.3 |
| Keith L. Belknap | Adjusted Income from Continuing Operations | 55 | 52.7 |
| 65.8 |
| 79.0 |
| 68.5 |
| 120.4 |
| Technologies Adjusted Operating Income (Loss) | 35 | (5.0 | ) | 0 |
| 5.0 |
| (9.7 | ) | 0 |
| | EHS | 10 | — |
| — |
| — |
| — |
| 75.0 |
| Gregory S. Rogowski | Infrastructure Adjusted Operating Income | 40 | 138.4 |
| 173.0 |
| 207.6 |
| 166.2 |
| 80.2 |
Infrastructure Adjusted Net Sales | 25 | 715.7 |
| 753.0 |
| 790.6 |
| 729.6 |
| 37.1 |
| Adjusted Income from Continuing Operations | 25 | 52.7 |
| 65.8 |
| 79.0 |
| 68.5 |
| 120.4 |
| | EHS | 10 | — |
| — |
| — |
| — |
| 137.0 |
| Marietta Edmunds Zakas | Adjusted Income from Continuing Operations | 90 | 52.7 |
| 65.8 |
| 79.0 |
| 68.5 |
| 120.4 |
| | EHS | 10 | — |
| — |
| — |
| — |
| 128.3 |
Fiscal 2017 Annual Cash Incentive Awards
Fiscal 2017goals were set with minimum (or threshold), target and maximum objectives for each goal as described in the “Performance Targets and Results” table below.
| | | | | | | | | | | | | | | | | | | | | | | | | | | | | | | | |
| 2022 ANNUAL PERFORMANCE TARGETS AND RESULTS |
| | | | | | | | | | |
| | Weighted Aggregate Actual % of Target for Ms. Zakas and Messrs. Hall, Heinrichs and Helms 89.3% |
| Metric | Weight (% of Target Bonus)( | | Results Required to Achieve Bonus ($ in millions, except for percentages)(1) | | Actual 2022 Payout Factor (% of Target Bonus) unweighted | |
| | |
Hall
Zakas
Heinrichs
Helms | Takeuchi | | Threshold
(50%) | Target
(100%) | Maximum
(200%) | | |
| Adjusted EBITDA | 50.0% | 45.0% | | | | 60.6% | |
| Net Sales | 25.0% | 20.0% | | | | 190.0% | |
| Adjusted Working Capital as a % of Net Sales | 15.0% | 15.0% | | | | 76.8% | | Weighted Aggregate Actual % of Target for Mr. Takeuchi 91.0% |
WMS Segment Net Sales(2) | — | 10.0% | | | | 142.0% | |
WMS Segment Adjusted EBITDA(2) | — | 10.0% | | | | —% | |
EHS(3) | 10.0% | — | | — | — | — | | —% | |
(1)See Exhibit A for a reconciliation of non-GAAP performance measures to GAAP performance measures.
(2)Applicable to only Mr. Takeuchi. “Segment Performance” includes (i) the Water Management Solutions (“WMS”) segment’s Net Sales and (ii) the WMS segment’s Adjusted EBITDA, each weighted 10% of Mr. Takeuchi’s total incentive target compensation.
(3)Applicable to Ms. Zakas and Messrs. Hall, Heinrichs and Helms.
FISCAL 2022 ANNUAL CASH INCENTIVE AWARDS
Based on actual performance against the performance goals as set forth above, each NEO earned 89.3% of his or her annual cash target opportunity for fiscal 2022 with the exception of Mr. Takeuchi, who earned 91.0%. The table below shows each NEO’s annual cash target opportunity and the amount of the annual cash bonuses paid to each NEO are set forth in the following table:NEO. | | | | | | | | | | | | | | | | | |
| At Target Performance |
| At Actual Performance |
| Name | % of Salary | Amount ($) | | % of Target | Amount ($) |
| J. Scott Hall | 105 | % | 886,438 | |
| 89.3 | % | 791,767 |
| Marietta Edmunds Zakas | 70 | % | 314,070 | |
| 89.3 | % | 280,528 |
| Steven S. Heinrichs | 60 | % | 272,515 | |
| 89.3 | % | 243,410 |
| Todd P. Helms | 60 | % | 220,602 | |
| 89.3 | % | 197,041 |
| Kenji Takeuchi | 50 | % | 185,031 | |
| 91.0 | % | 168,359 |
46 MUELLER WATER PRODUCTS, INC.
|
| | | | | | |
| Name | At Target Performance | At Actual Performance |
| % of Salary | Amount ($) | % of Target | Amount ($) |
Gregory E. Hyland(1) | 100 | 301,736 |
| 121.2 | 365,674 |
|
Scott Hall(1) | 100 | 750,000 |
| 121.2 | 908,925 |
|
| Evan L. Hart | 75 | 310,325 |
| 121.2 | 376,083 |
|
| Keith L. Belknap | 70 | 307,417 |
| 73.7 | 226,627 |
|
| Gregory E. Rogowski | 75 | 331,250 |
| 85.2 | 282,075 |
|
| Marietta Edmunds Zakas | 60 | 211,180 |
| 121.2 | 255,929 |
|
| |
(1) | Mr. Hyland’s 2017 bonus was based on his salary in effect, and performance achieved, during the period in which he served as President and Chief Executive Officer (from October 2016 through January 2017). Mr. Hall’s annual bonus for fiscal 2017 was not pro rated. |
Long-Term Equity-Based Compensation
For fiscal 2017, ourThe long-term incentive program included grantsaligns the interests of performance-based restrictedour NEOs with those of our stockholders and rewards our NEOs for achieving key metrics. This program drives operating results, enhances stockholder value and helps retain our NEOs. Due to the rules for how the grant date fair value of long-term incentive awards must be calculated for accounting purposes, the 2022 Summary Compensation Table may not reflect the same stock units (“PRSUs”)option and time-vested RSUs. ThePRSU values described below. In addition, accounting values can increase or decrease each year, causing volatility in the long-term incentive awards reported. For fiscal 2020 through fiscal 2022, the Compensation Committee targetsset each NEO’s target long-term compensation value for each NEO at or about the regressed 50th50th percentile of comparable executives in the Peer Group.
For fiscal 2017,2022 and fiscal 2021, the NEOs’ target long-term compensation value for each NEO was withinallocated 50% in the 50th percentile target rangeform of performance-based restricted stock units (“PRSUs”), 25% in the Peer Group.
Performance-Based Restricted Stock Unitsform of time-based stock options and 25% in the form of time-based restricted stock units (“RSUs”). The fiscal 2022 and fiscal 2021 PRSUs are based solely upon rTSR performance ("Market Units").
For fiscal 2017,2020, the NEOs’ target long-term compensation value was allocated 70% in the form of PRSUs and 30% in the form of RSUs. Fiscal 2020 PRSUs were divided into two categories, based upon applicable performance metric: (i) 57% of the PRSUs (and 40% of the total award) are based upon after-tax RONA achievement ("RONA Units") and (ii) 43% of the PRSUs (and 30% of the total award) are based solely upon rTSR performance, i.e., Market Units.
PERFORMANCE-BASED RESTRICTED STOCK UNITS
The following are the key aspects of the PRSUs awarded, granted, earned and/or vested in fiscal 2022 and fiscal 2021:
PRSUs Awarded for Fiscal 2022 and Fiscal 2021:
•For fiscal 2022 and fiscal 2021, 50% of each NEO’s target long-term incentive compensation value was awarded in the form of PRSUs. The key terms of the PRSUs are as follows:
Each PRSU award reflects a target number of shares (based onPRSUs awarded in fiscal 2022 and fiscal 2021 was equal to the fair markettarget value divided by the share price of our Common Stock on the award date)date of award.
•The fiscal 2022 and fiscal 2021 PRSUs are based solely upon the Company’s rTSR performance, i.e., Market Units.
•Market Units:
◦The relative total shareholder return or “rTSR” is measured by, during the applicable performance period, computing the total shareholder return of each company that may be issuedwas in the S&P 600 SmallCap Industrial Index at the beginning of the applicable performance period (the “TSR Group”) and comparing the Company’s total shareholder return results thereto in order to determine the quartile ranking within the TSR Group.
◦The Market Units consist of a single tranche and vest on a 3-year cumulative performance period against the applicable index.
◦The Compensation Committee establishes the performance period target related to the Market Unit award recipient aton the grant date of the award.
◦At the end of athe three-year award cycleperiod, the Compensation Committee confirms actual performance against the applicable performance target.
◦The number of shares of our Common Stock earned at the conclusion of each Market Unit performance period may range from zero to two times the number of target Market Units awarded, based on the level of achievement ofagainst the applicable performance targets.period target.
PRSUs Awarded for Fiscal 2020:
•For fiscal 2020, 70% of each NEO’s target long-term incentive compensation value was awarded in PRSUs. The number of PRSUs awarded in fiscal 2020 was equal to the target value divided by the share price of our Common Stock on the date of award. As noted above, the fiscal 2020 PRSUs comprise RONA Units and Market Units.
•Market Units: Market Unit details are described above for fiscal 2021 and fiscal 2022.
• RONA Units:
◦RONA Units are divided into three equal tranches and each tranche is measured and earned over successive one-year performance periods coinciding with our fiscal years.
PROXY STATEMENT FOR 2023 ANNUAL MEETING 47
◦The Compensation Committee establishes RONA Unit performance period targets for the then-current performance period on an annual basis.
◦At the end of each performance period, the Compensation Committee confirms actual performance against the applicable performance period target.
◦The number of shares of our Common Stock earned at the conclusion of each applicable RONA Unit performance period may range from zero to two times the number of target RONA Units in the applicable tranche, based on the level of achievement against the applicable annual performance target.
Each performance period target is established by the Compensation Committee on an annual basis coinciding with our fiscal year.target.
At the end of each fiscal year, the Compensation Committee confirms performance against the applicable performance target, and PRSUs◦RONA Units representing the level of achievement during thatthe specific performance period are “banked” for potential payout following the end of the three-year award cycle.
EarnedPRSUs Generally:
•All PRSUs are settled in shares of Common Stock. The actual number
•To receive earned shares of shares a participant may receive ranges from zero to two timesCommon Stock, the target numberNEO must be employed through the last day of shares, depending solely on the level of achievement during each performance period within thethree-year award cycle.
•PRSUs do not convey voting rightsrights or earn dividends.accrue dividends until vested.
Timeline for PRSU Grants |
| | | | | |
Grant | Fiscal 2015 | Fiscal 2016 | Fiscal 2017 | Fiscal 2018 | Fiscal 2019 |
Fiscal 2015 | Performance Period | Performance Period | Performance Period | | |
Fiscal 2016 | | Performance Period | Performance Period | Performance Period | |
Fiscal 2017 | | | Performance Period | Performance Period | Performance Period |
PERFORMANCE MEASURE AND RESULT FOR FISCAL 2022
Performance Measure and Result for Fiscal 2017
The applicable performance target for the fiscal 2017fiscal 2022 performance period for PRSUs awarded in fiscal 2020 was based partially on RONA and partially on rTSR. The applicable performance targets for the fiscal 2021 and fiscal 2022 performance periods for PRSU awards made in fiscal 2015, fiscal 20162021 and fiscal 2017 was2022, respectively, were based solely on the percentage year-over-year improvementrTSR. No RONA Units were awarded in return on net assets,fiscal 2021 or “RONA.” For these purposes, the termfiscal 2022. “RONA” hashas the meaning described in footnote 4 to the table under “— Highlights of 20172022 Performance Related to Executive Compensation”. Compensation.”
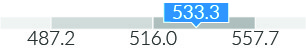
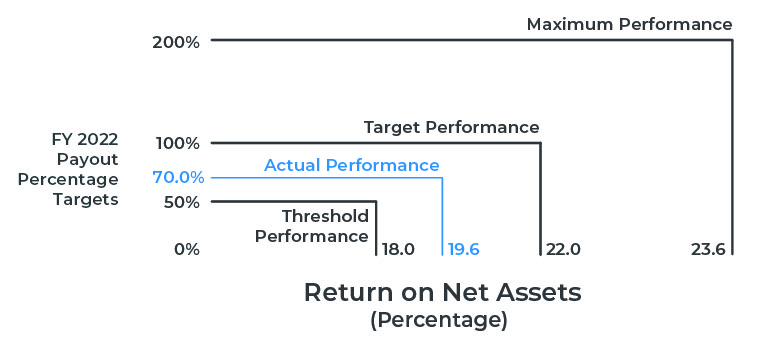
The Compensation Committee determined the RONA target using benchmark data from the Peer Group and assistance from the Company’s independent compensation consultant. For fiscal 2020, fiscal 2021 and fiscal 2022, the Compensation Committee established the RONA target at an absolute percentage on an after-tax basis. For fiscal 2022, the performance necessary to earn aat least 50% of RONA Unit target payout required a 1.16% year-over-year improvement in RONA of 18.0%, the performance necessary to earn 100% of RONA Unit target payout required RONA of 22.0%, and the performance necessary to earn athe maximum 200% of RONA Unit target payout required RONA of at least an 8.00% year-over-year improvement in RONA.23.6%. Actual RONA performance for fiscal 20172022 was 34.41%, compared to19.6%. Therefore, the 2022 performance period RONA of 34.01% for fiscal 2016, a 1.16% improvement. Accordingly, the recipients of PRSU awards were each credited with 100.0%Units will settle at 70.0% of the awards attributable to the fiscal 2017 performance period.awards. See “Executive Compensation — Grants of Plan-Based Awards Table”Table.”
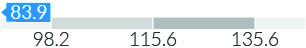
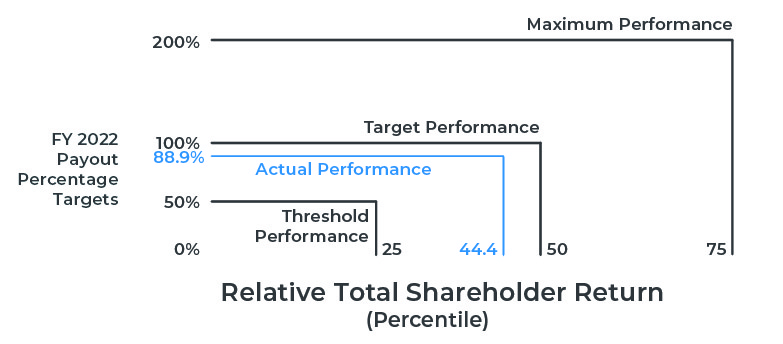
The Compensation Committee determined the rTSR target using benchmark data from the S&P 600 SmallCap Industrial Index (based upon a 20 trading day average) and assistance from the Company’s independent compensation consultant. For fiscal 2020, fiscal 2021 and fiscal 2022 grants, the performance necessary to earn 100% of Market Unit target payout requires the rTSR to be in the 50th percentile, and the performance necessary to earn the minimum of 50% and a maximum of 200% of Market Unit target payout requires the rTSR to be in the 25th and 75th percentile, respectively. The fiscal 2020, fiscal 2021 and fiscal 2022 Market Unit grants vest and settle at the end of the corresponding cumulative 3-year performance period. For the fiscal 2020 Market Unit grants, the performance during the actual performance period resulted in a Company rTSR in the 44.4% percentile, resulting in an achievement of 88.9%.
48 MUELLER WATER PRODUCTS, INC.
| | |
| PRSU PERFORMANCE MEASURES AND RESULTS FOR FISCAL 2022 |
|
|
PRSU Awards Issued
AWARD ISSUANCES
Common Stock to be issued related to PRSUs awarded in fiscal 20162021 (for the three-year award cycle from fiscal 20162021 through fiscal 2018)2023) and fiscal 20172022 (for the three-year award cycle from fiscal 20172022 through fiscal 2019)2024) will not be issued until the Compensation Committee certifiesconfirms performance results for the fiscal 20182023 and fiscal 20192024 performance periods.periods, respectively. Shares of Common Stock issued in December 2022 to NEOs for the PRSUs awarded in fiscal 20152020 (for the three-year award cycle from fiscal 20152020 through fiscal 2017)2022) and vested in fiscal 2022 are set forth in the following table:below:
| PRSU Settlements |
| | | | | |
| | Shares Earned | |
| Name | Fiscal 2015(1) (#) | Fiscal 2016(1) (#) | Fiscal 2017 (#) | Total Shares Issued (#) |
| Gregory E. Hyland | 0 | 34,798 | 34,083 | 68,881 |
|
| Evan L. Hart | 0 | 9,795 | 9,594 | 19,389 |
|
| Keith L. Belknap | 0 | 6,959 | 6,816 | 13,775 |
|
| Gregory E. Rogowski | 0 | 9,395 | 9,202 | 18,597 |
|
| Marietta Edmunds Zakas | 0 | 4,697 | 4,601 | 9,298 |
|
| | | | | | | | | | | | | | | | | |
(1)Year of Award | See the definitive proxy statements we filed with the SEC on January 15, 2016 and December 15, 2016, respectively, for information concerning target Performance Period |
| Fiscal 2020 | Fiscal 2021 | Fiscal 2022 | Fiscal 2023 | Fiscal 2024 |
| | | | | |
| Fiscal 2020 |
|
| Vested 2020 RONA performance and actual RONA performance for the 2015 and 2016 performance periods.UNIT Awards (3 Tranches) | |
|
| |
| | | |
| Vested 2020 Market Unit Awards
(1 Tranche) | | |
| | | | | |
| Fiscal 2021 |
| Future Vesting of 2021 Market Unit Awards
(1 Tranche) | |
| | | | | |
| Fiscal 2022 | | | Future Vesting of 2022 Market Unit Awards
(1 Tranche) |
| | | | | |
Time-Based Restricted Stock Units
As described above, a portion of an executive’s long-term incentive award value has historically beenPROXY STATEMENT FOR 2023 ANNUAL MEETING 49
| | | | | | | | | | | | | | |
| PRSU SETTLEMENTS OF FISCAL 2020 AWARD | | | | |
| | | | |
| Performance Periods | Total Issued Number of Shares |
| Fiscal 2020 | Fiscal 2021 | Fiscal 2022(1) |
| Name | Number of Shares Earned(2) |
| J. Scott Hall | 22,603 | 28,869 | 67,145 | 118,617 |
| Marietta Edmunds Zakas | 6,672 | 8,522 | 19,822 | 35,016 |
| Steven S. Heinrichs | 5,219 | 6,666 | 15,505 | 27,390 |
| Todd P. Helms | 2,099 | 4,462 | 9,355 | 15,916 |
| Kenji Takeuchi | 3,228 | 4,123 | 9,590 | 16,941 |
(1)Fiscal 2022 shares earned includes shares awarded inbased on RONA and rTSR.
(2)See the form of time-based RSUs. definitive proxy statements we filed with the SEC on December 21, 2020 and December 22, 2021, respectively, for information concerning target RONA performance and actual RONA performance for the fiscal 2020 and fiscal 2021 performance periods.
TIME-BASED RESTRICTED STOCK UNITS
For fiscal 2017, 50%2022, 25% of each NEO’s target long-term incentive compensation value was awarded in RSUs. The Compensation Committee approves a dollar value for these awards and its compensation consultant calculates the number of RSUs that equals thatawarded was equal to the compensation value baseddivided by the price of our Common Stock on the grant date stock price.of award. Typically, one-third of the RSUs grantedawarded vest on each anniversary of the grantaward date. See “Executive Compensation — Grants of Plan-Based Awards Table”.Table.”
TimingTIME-BASED STOCK OPTIONS
For fiscal 2022, 25% of each NEO’s target long-term incentive compensation value was awarded in stock options. The number of stock options awarded was equal to the compensation value divided by the grant date fair value of our Common Stock on the date of award. Typically, one-third of the stock options awarded vest on each anniversary of the award date. Due to the rules for how the grant date fair value of long-term incentive awards must be calculated for accounting purposes, the 2022 Summary Compensation Table may not reflect the same stock option values described above. In addition, accounting values can increase or decrease each year, causing volatility in the long-term incentive awards reported. The amounts reported in the Option Awards column in the 2022 Summary Compensation Table represent the grant date fair value of stock option awards granted under the Stock Plan to each of the NEOs, calculated in accordance with ASC Topic 718. We use a Black-Scholes model when determining the grant date fair value of stock options. For information on the assumptions used by us in calculating these values, see Note 12 to our consolidated financial statements in the Form 10-K. To see the value actually received upon exercise of options by the NEOs in fiscal 2022, refer to the 2022 Option Exercises and Stock Vested table in this Proxy Statement. Outstanding option awards are reflected in the 2022 Outstanding Equity Awards table in this Proxy Statement. Also see the “Executive Compensation — Grants of Plan-Based Awards Table” for additional information.
TIMING OF EQUITY AWARDS
While the Compensation Committee may grant equity-based awards at any of its scheduled meetings or by unanimous written consent, it generally grantsestablishes awards for executives at its November or December meeting each year, except for awards related to promotions or new hires. GrantsAwards approved during scheduled meetings become effective and are priced as of the date of approval or as of a pre-determinedpredetermined future date based on a date of hire. GrantsAwards approved by unanimous written consent become effective and are priced as of a pre-determinedpredetermined future date. All stock options have a per-share exercise price equal to the closing stock price on the NYSE on the effective date of the grant.award.
Other Cash and Equity Awards
Mr. Hall’s employment agreement provides for an initial long-term incentive opportunity valued at $1.5 million on the date of grant, comprised of (i) 50% in RSUs that vest ratably over three years and (ii) 50% in PRSUs vesting, to the extent earned, at the end of fiscal 2019. The awards for the fiscal 2017 performance period are not pro rated.None.
As an offset for forfeited performance and equity awards under Textron’s incentive plans, Mr. Hall was granted 56,069 RSUs, as determined in accordance with his employment agreement. These RSUs vest in full on the first anniversary of the commencement of Mr. Hall’s employment.
In May 2017, we entered into an agreement with Mr. Rogowski that will provide him with a lump sum payment of $550,000 in cash, provided he remains employed with the Company through February 16, 2020. The award is forfeited if, prior to such date, Mr. Rogowski’s employment is terminated by the Company with cause (as such term is defined in his employment agreement) or by Mr. Rogowski for any reason. If Mr. Rogowski’s employment is involuntarily terminated prior to such date by reason of death or disability, a pro rata portion of the cash award would be payable.
Retirement Benefits
We offer retirement benefits to our NEOs and other employees intended to provide a competitive source of retirement income. These retirement benefits are provided through the vehicles described below.
Retirement Savings Plan Applicable to Employees Generally50 MUELLER WATER PRODUCTS, INC.
RETIREMENT SAVINGS PLAN APPLICABLE TO EMPLOYEES GENERALLY
The Mueller Water Products, Inc.Group LLC Retirement Savings Plan is a 401(k) plan that provides retirement benefits for our non-union employees and those of our participatingparticipating subsidiaries. Each of our NEOs participated in the plan in fiscal 20172022 on the same basis as our other eligible employees.
Deferred Compensation Plan
Mr. Hyland is the only NEO who participates in a deferred compensation plan. He participates in an unfunded deferred compensation plan (the “Retirement Plan”), pursuant toemployees, under which we credited a bookkeeping account for him, commencing April16, 2007 and each calendar month thereafter through September16, 2010,make matching contributions in accordance with an amount equal to 10%the terms of his then current monthly base salary. The amounts credited to the plan bear interest at 120% of the long-term Applicable Federal Rate (as defined in the Code) until payment. At September30, 2017, $663,814 had been accrued and credited to Mr.Hyland’s deferral account. No further accruals will occur to the account, except for interest. Our fiscal 2017 interest accruals to the plan for Mr.Hyland were $19,754.that plan.
Upon termination of his employment with us, other than for cause, all deferred compensation under the Retirement Plan will be paid as a lump sum to Mr.Hyland.
Other Benefits
PerquisitesPERQUISITES
We provide certain perquisites to theour NEOs that the Compensation Committee believes are reasonable and consistent with itsour overall compensation program. In fiscal 2017,2022, the Compensation Committee offered the NEOs limited perquisites, including a car allowance,allowance (excluding Messrs. Helms and Takeuchi), life insurance, supplementalsupplemental long-term disability insurance and reimbursement for certain financial planning and annual physical examination expenses. See “Executive Compensation — Summary Compensation Table -— All Other Compensation”.Compensation.”
Severance BenefitsSEVERANCE BENEFITS
Each NEO is entitled to severance benefits. See “Executive Compensation — Potential Payments Upon Termination or Change-in-Control”.Change-in-Control.”
Change-in-Control AgreementsCHANGE-IN-CONTROL BENEFITS
Change-in-control agreements are used to create incentives for executives to build stockholder value and to seek the highest value possible for stockholders should we be acquired, despite the risk of losing employment. Our change-in-control agreements for executives provide for vesting of outstanding equity-based awards and payment of severance amounts upon a change-in-control and operate with a “double trigger”for severance payments and equity awards, meaning severance payments and accelerated vesting of equity awards do not occur unless the executive’s employment is involuntarily terminated (other than for causeCause or for termination for good reason)Good Reason as defined in the agreements) within 24 months following a change-in-control. The Compensation Committee believes this structure strikes an appropriate balance of incenting executives without providing benefits to executives who continue to enjoy employment with an acquiring company. The Compensation Committeeagreements also believes this structure is more attractive to potential acquiring companies that may place significant value on retaining members of our executive team and may perceive this objective to be undermined if executives receive significant severance payments solely
upon the closing of such a transaction. The agreements for Messrs. Rogowski and Hart and Ms. Zakas provide for an additional payment sufficient to eliminate the effect of any applicable excise tax on severance payments in excess of any amount determined under 280G of the Code. We would not be able to deduct payments subject to the excise tax for federal and state income tax purposes. The agreements for Messrs. Hall and Belknap contain a “best-of-net” provision, so that, in the event excise taxes would be imposed on payments under the agreements, the NEO will, at his or her discretion, either (1) pay the excise tax without assistance from the Company or (2) have the payments reduced to an amount at which an excise tax would no longer be payable, based on which resultpayable.
The Company provides NEOs without a change-in-control agreement with change-in-control benefits via the Company's executive severance plan approved by the Compensation Committee and instituted by the Company in January 2020. For applicable employees, the executive severance plan provides, upon a change-in-control, for vesting of outstanding equity-based awards if a replacement award (as defined in the executive severance plan) is more favorable tonot available and for payment of severance amounts if the NEO on an after-tax basis.executive’s employment is involuntarily terminated (other than for Cause or for termination for Good Reason as defined in the agreement) within 24 months following a change-in-control, i.e., a “double trigger.”
Employee Stock Purchase PlanEMPLOYEE STOCK PURCHASE PLAN
Our Employee Stock Purchase Plan (“ESPP”) provides all of our employees an opportunity to purchase Common Stock, subject to certain restrictions, through regular payroll deductions. During fiscal 2017, Messrs. Hart and Belknap were the only NEOs to participate in the ESPP.
Health and Welfare BenefitsHEALTH AND WELFARE BENEFITS
We generally offer group medical, dental, vision, life and long-term disability insurance in a flexible benefits package to all active U.S. employees, except as otherwise required by collective bargaining agreements. Employees are provided life insurance up to one times their base salaries at no charge, other than related income taxes, to the employee. For an additional charge, employees may obtain coverage of up to four times their base salary up to a maximum life insurance benefit of $1,250,000. NEOs participate on the same basis as other eligible employees.
PROXY STATEMENT FOR 2023 ANNUAL MEETING 51
Other Factors Considered by the Compensation Committee
Risk and Incentive Compensation
The Compensation Committee has conducted an assessment of our compensation policies and practices and does not believe these policies and practices are reasonably likely to have a material adverse effect on us. This assessment included a review of the risk profile of our compensation policies and practices for all employees. To facilitate its review, the Compensation Committee engaged its compensation consultant to review our compensation structure to identify design elements that might encourage excessive risk taking. The compensation consultant discussed its review and conclusions with the Compensation Committee. In conducting its review, the Compensation Committee noted several policies and practices that mitigate risk, including:
•Using multiple performance measures in annual incentive awards and capping payout levels;
•Maintaining the ability to reduce annual incentive awards, based on its independent judgment;
•Using multiple long-term incentive vehicles;
•Using overlapping multi-year award cycles in connection with performance shares and capping payout levels; and
•Maintaining stock ownership guidelines, an anti-hedging policy, an anti-pledging policy and a clawback policy.
Tally Sheets
The Compensation Committee regularly reviews “tally sheets” for each executive. The tally sheets contain information concerning prior years’ compensation, proposed compensation for the current year, outstanding equity-based awards (both vested and unvested) and various termination-of-employment scenarios. The tally sheets enableassist the Compensation Committee to view and evaluatein evaluating the many facets of executive compensation, understandunderstanding the magnitude of potential payouts as a result of termination-of-employment scenarios and considerconsidering changes to our compensation programs, arrangements and plans in light of emerging trends.
Wealth Accumulation Review
The Compensation Committee reviews “wealth accumulation” calculations, such as projections of how much stock an executive is projected to earn or accrue over time through cash and equity-based compensation or through certain benefits.
Other Compensation Practices and Policies
Role of Compensation Consultant in Compensation Decisions
The Compensation Committee has sole authority to select and retain a compensation consultant, including authority to approve fees and retention terms. For fiscal 2017,2022, the Compensation Committee retained Meridian Compensation Partners,Farient Advisors, LLC as its compensation consultant. The Compensation Committee reviews the performance of its compensation consultant annually.
In fiscal 2017,2022, the compensation consultant’s responsibilities included, but were not limited to:
•Providing recommendations regarding the composition of our Peer Group;
•Preparing and analyzing Peer Group compensation and plan design data;
•Reviewing and advising on the performance measures to be used in incentive awards;
•Valuing equity-based awards; and
•Reviewing and advising on principal aspects of executive and non-employee director compensation, including base salaries, bonuses, perquisites and equity-based awards for executives, and cash compensation and equity-based awards for non-employee directors.
The Compensation Committee considered the independence of its compensation consultant in light of standards under the NYSE Manual.listing standards. The Compensation Committee requested and received a letter from the compensation consultant addressing its independence, including the factors described below:
•Other services provided to us by the consultant;
•Fees paid by us as a percentage of the consultant’s total revenue;
•Policies or procedures maintained by the consultant that are designed to prevent a conflict of interest;
•Any business or personal relationships between the individual consultants involved in the engagement and a member of the Compensation Committee;
•Any Common Stock owned by the individual consultants involved in the engagement; and
52 MUELLER WATER PRODUCTS, INC.
•Any business or personal relationships between our executives and the consultant or the individual consultants involved in the engagement.
The Compensation Committee took into account these considerations, along with other factors relevant to the compensation consultant’s independence from management, and concluded the compensation consultant is independent and the engagement of the compensation consultant and the services rendered by the compensation consultant did not raise any conflict of interest.
Role of Management in Compensation Decisions
The Compensation Committee reviews information provided by its compensation consultant and uses that information as a reference point for the components of compensation. The Compensation Committee and the Chief Executive Officer discuss the financial metrics and operational goals intended to closely align performance targets of the business units and the Company as a whole with our strategic goals. The Chief Executive Officer makes recommendations to the Compensation Committee for executives other than himself with respect to annual salary adjustments, annual incentive adjustments and grants of equity-based awards under our incentive plans. The Compensation Committee makes the final decision with respect to the compensation of these executives, taking into consideration the Chief Executive Officer’s recommendations.
The Compensation Committee annually receives input from the entire Board with respect to the Chief Executive Officer’s performance and recommends his compensation level to the Board. The Board discusses and approves the annual salary of the Chief Executive Officer. The Chair of the Compensation Committee and another Compensation Committee member designated byNon-Executive Chair of the ChairBoard meet with the Chief Executive Officer to discuss the Chief Executive Officer’s performance and compensation based on evaluations received from the Board. These discussions are considered by the Compensation Committee in setting all elements of compensation for the Chief Executive Officer.
In fiscal 2017,2022, the Chief Executive Officer was present at all of the Compensation Committee meetings but was excused from the executive sessions of the Compensation Committee and did not participate in meetings or deliberations during which his compensation was discussed.
Income Tax Consequences of Executive Compensation
Our compensation programs were designed to permit us to deduct compensation expense under Section 162(m) of the Internal Revenue Code, which historically limited the tax deductibility of annual compensation paid to executives to $1 million, unless the compensation qualified as “performance-based.” The exemption from Section 162(m)’s deduction limit for performance-based compensation has been repealed (subject to certain transition rules), effective for taxable years beginning after December 31, 2017, such that compensation paid to our NEOs in excess of $1 million is generally deniesnot deductible. As a corporate taxresult, we may no longer take a deduction for annualany compensation exceeding $1 million paid to our NEOs (other thanin excess of $1 million. In fiscal 2022 and in plans for fiscal 2023, the CFO). The limitation does not applyCompensation Committee continued to design compensation based on achievementprograms and make grants that it believes are performance-based and well aligned with the interests of pre-established performance goals if certain requirements are met. The 2006our stockholders.
Previous grants made under the Stock Plan, and the PRSUs granted thereunder, as well as the annual cash incentive award, arewere structured and were intended to permit such awards to qualify as performance-based“performance-based” compensation to maximize the tax deductibility of these awards. Theseawards under Section 162(m). Those awards may not be fully deductible under all circumstances, as a number of additional requirements must be met for the awards to qualify as performance-based“performance-based” compensation. In addition, the Compensation Committee believes stockholder interests are best served by not restricting its discretion and flexibility in structuring compensation programs, even though such programs may result in certain non-deductible compensation expenses, and therefore, it reserves the discretion to award compensation that is not exempt from the deduction limits of Section 162(m).
Compensation Recovery (Clawback) Policy
Our employment agreements contain a provision requiring the employee,NEOs are required, to the extent required by law, to reimburse us following the publication of a restatement of our financial statements due to material noncompliance with any financial reporting requirement under the securities laws as a result of misconduct for (a)incentive-based or equity-based compensation received and (b)any profits realized from the sale of our securities in each case during the 12 months prior to discovery of the noncompliance. The Compensation Committee has exclusive authority to interpret and enforce this provision.
The Compensation Committee has adopted a “Clawback Policy” to recover pay that is determined to have been wrongfully earned by managerial or executive employees, including our NEOs. As a result, all RSUsequity awards granted after November 30, 2009 include a clause that reduces the number of equity-based awards upon the occurrence of certain events. The Compensation Committee has the exclusive authority to interpret the Clawback Policy and may offset compensation as necessary to recover amounts due under the Clawback Policy.
PROXY STATEMENT FOR 2023 ANNUAL MEETING 53
Prohibition on Hedging and Pledging
We do not allow directors or employees to hedge the value of our equity securities held directly or indirectly by them. Our policy prohibits the purchase or sale of puts, calls, options or other derivative securities based on our securities, as well as hedging or monetization transactions, purchases of our equity securities on margin and borrowing against any account in which our securities are held. We prohibit pledging of Common Stock by executives or directors.
Stock Ownership Guidelines
The Compensation Committee has adopted stock ownership guidelines to promote a high level of stock retention among executives and non-employee directors. The guidelines require that the total value of the executive’s or non-employee director’s holdings of Common Stock must equal or exceed the specified target value shown below.
|
| | | | | | | |
| Position/Title | | Target Ownership |
| Chief Executive Officer and President | | 6 x6x base salary |
| Executive Vice Presidents | | 3 x 3xbase salary |
| Senior Vice Presidents | | 2 x2x base salary |
| Vice Presidents | | 1x base salary |
| Non-Employee Directors | | 5 x5x annual retainer |
Participants have five (5) years from the date a participant becomes subject to the program to achieve the applicable stock ownership target. If a participating individual is promoted, the promoted participant has three (3) years from the date of promotion to increase his or her holdings to meet the applicable stock ownership requirements. All NEOs and directors are in compliance with our stock ownership requirements.guidelines. Our stock ownership guidelines are available on our website. Seewebsite at www.muellerwaterproducts.com.
Report of the Guidelines for more detail.
REPORT OF THE COMPENSATION AND HUMAN RESOURCES COMMITTEECompensation and Human Resources Committee
The Compensation Committee participated in the preparation of the Compensation Discussion and Analysis. Based on its review and discussions with management, the Compensation Committee recommended to the Board that the Compensation Discussion and Analysis be included in this Proxy Statement.
See “Corporate Governance— Board Operations“Board Structure — Board Committee Information” for information concerning the Compensation Committee and its responsibilities.
| | | | | |
|
| Compensation and Human Resources Committee |
Michael | MICHAEL T. Tokarz, ChairmanTOKARZ, CHAIR |
Shirley | SHIRLEY C. FranklinFRANKLIN |
Jerry W. Kolb | THOMAS J. HANSEN |
| JEFFERY S. SHARRITTS |
| STEPHEN C. VAN ARSDELL |
Executive Compensation Tables Summary Compensation Table
The amounts reported in the following table, including base salary, annual and long-term incentive amounts, benefits and perquisites, are described more fully under “Compensation Discussion and Analysis”.Analysis.”
| | | | | | | | | | | | | | | | | | | | | | | | | | |
| Name and Principal Position | Fiscal
Year | Salary(1) ($) | Bonus
($) | Stock Awards(2) ($) | Option Awards(3) ($) | Non-Equity Incentive Plan Compensation(4) ($) | All Other Compensation(5) ($) | Total
($) |
J. Scott Hall President and Chief Executive Officer | 2022 | 844,227 | — | 2,470,487 | 643,742 | 791,767 | 56,873 | 4,807,096 |
| 2021 | 821,821 | — | 2,910,266 | 540,491 | 1,223,178 | 53,275 | 5,549,031 |
| 2020 | 777,786 | — | 2,509,534 | — | 946,456 | 52,990 | 4,286,766 |
Marietta Edmunds Zakas Executive Vice President and Chief Financial Officer | 2022 | 448,672 | — | 642,729 | 163,879 | 280,528 | 54,270 | 1,590,078 |
| 2021 | 432,791 | — | 816,844 | 147,965 | 443,070 | 46,968 | 1,887,638 |
| 2020 | 404,692 | — | 755,866 | — | 344,717 | 49,395 | 1,554,671 |
Steven S. Heinrichs Executive Vice President, Chief Legal and Compliance Officer and Secretary | 2022 | 454,191 | — | 502,452 | 128,111 | 243,410 | 46,322 | 1,374,485 |
| 2021 | 440,241 | — | 642,337 | 116,232 | 386,312 | 43,816 | 1,628,938 |
| 2020 | 413,001 | — | 521,697 | — | 301,538 | 36,975 | 1,273,211 |
Todd P. Helms Senior Vice President and Chief Human Resources Officer | 2022 | 367,670 | — | 349,316 | 89,677 | 197,041 | 29,505 | 1,033,209 |
| 2021 | 355,801 | — | 360,161 | 81,362 | 312,216 | 31,484 | 1,141,023 |
| 2020 | — | — | — | — | — | — | — |
Kenji Takeuchi Senior Vice President, Water Management Solutions | 2022 | 370,061 | — | 346,808 | 90,120 | 168,359 | 19,507 | 994,855 |
| 2021 | 356,962 | — | 311,731 | 69,732 | 234,925 | 19,466 | 992,816 |
| 2020 | — | — | — | — | — | — | — |
|
| | | | | | | | | | | | | | | | | | | | | |
Name and Principal Position(1) | Fiscal Year | Salary(2) ($) | Bonus(3) ($) | Stock Awards(4) ($) | Non-Equity Incentive Plan Compensation(5) ($) | Change in Pension Value and Nonqualified Deferred Compensation Earnings(6) ($) | All Other Compensation(7) ($) | Total ($) |
Gregory E. Hyland Executive Chairman, Former President and Chief Executive Officer | 2017 | | 968,403 |
| — |
| | 2,256,468 |
| | 365,674 |
| | 19,754 |
| | 49,624 |
| | 3,659,923 |
|
| 2016 | | 900,000 |
| 27,000 |
| | 2,020,011 |
| | 1,160,658 |
| | 17,669 |
| | 53,791 |
| | 4,179,129 |
|
| 2015 | | 900,000 |
| 27,000 |
| | 2,248,099 |
| | 280,485 |
| | 19,044 |
| | 51,122 |
| | 3,525,750 |
|
Scott Hall President and Chief Executive Officer | 2017 | | 518,229 |
| — |
| | 1,657,694 |
| | 908,925 |
| | — |
| | 108,195 |
| | 3,193,043 |
|
| | | | | | | | | | | | | | |
| | | | | | | | | | | | | | |
Evan L. Hart Senior Vice President and Chief Financial Officer | 2017 | | 413,767 |
| — |
| | 641,505 |
| | 376,083 |
| | — |
| | 32,035 |
| | 1,463,390 |
|
| 2016 | | 401,367 |
| — |
| | 573,278 |
| | 388,208 |
| | — |
| | 31,801 |
| | 1,394,654 |
|
| 2015 | | 389,673 |
| — |
| | 652,443 |
| | 96,560 |
| | — |
| | 31,769 |
| | 1,170,445 |
|
Keith L. Belknap Executive Vice President, Business Development, General Counsel and Chief Compliance Officer | 2017 | | 439,167 |
| — |
| | 541,499 |
| | 226,627 |
| | — |
| | 40,295 |
| | 1,247,588 |
|
| 2016 | | 427,000 |
| — |
| | 470,670 |
| | 302,454 |
| | — |
| | 37,198 |
| | 1,237,322 |
|
| 2015 | | 385,760 |
| — |
| | 703,181 |
| | 89,218 |
| | — |
| | 38,787 |
| | 1,216,946 |
|
Gregory S. Rogowski Executive Vice President, Sales and Marketing | 2017 | | 441,667 |
| — |
| | 632,914 |
| | 282,075 |
| | — |
| | 37,372 |
| | 1,394,028 |
|
| 2016 | | 429,500 |
| — |
| | 552,069 |
| | 389,614 |
| | — |
| | 37,226 |
| | 1,408,409 |
|
| 2015 | | 418,382 |
| — |
| | 631,719 |
| | 196,283 |
| | — |
| | 34,005 |
| | 1,280,389 |
|
| Marietta Edmunds Zakas | 2017 | | 351,967 |
| 60,000 |
| | 393,623 |
| | 255,929 |
| | — |
| | 36,883 |
| | 1,098,402 |
|
| Executive Vice President, Strategy, Corporate Development and Communications | 2016 | | 338,567 |
| 145,000 |
| | 271,111 |
| | 261,973 |
| | — |
| | 36,612 |
| | 1,053,263 |
|
| | |
|
|
|
| |
|
| |
|
| |
|
| |
|
| |
|
|
| |
(1) | Effective January 23, 2017, Scott Hall was appointed President and Chief Executive Officer. Mr. Hall succeeded Gregory Hyland, Executive Chairman. |
| |
(2) | Mr. Hyland served as our President and Chief Executive Officer until January 23, 2017. Mr Hyland’s annualized salary was $900,000 during the period of October 1, 2016 through January 31, 2017, and $1,000,000 during the period of February 1, 2017 through September 30, 2017. |
| |
(3) | Payments made to Ms. Zakas were in recognition of assuming interim Human Resources responsibilities. See “Compensation Discussion and Analysis — Compensation Elements — Salary”. |
| |
(4) | The dollar amounts shown for RSU and PRSU awards represent the aggregate grant date fair values calculated in accordance with ASC 718, Stock Compensation, excluding the effect of forfeitures. See “Compensation Discussion and Analysis — Compensation Elements — Long-Term Equity-Based Compensation” for more information. The dollar amounts shown for fiscal 2017 include the aggregate grant date fair values of PRSUs awarded in fiscal 2015, 2016 and 2017 for the fiscal 2017 performance period assuming target performance. Assuming maximum performance, the aggregate values of PRSUs awarded for the fiscal 2017 performance period would have been: $500,016 for Mr. Hall; $2,512,956 for Mr. Hyland; $713,017 for Mr. Hart; $583,016 for Mr. Belknap; $387,272 for Ms. Zakas; and $693,842 for Mr. Rogowski. Estimated amounts that may be earned over the entire three-year award cycle of outstanding PRSUs are reflected in “Outstanding(2)“Stock Awards” comprise RSUs, Market Units and RONA Units. All RSUs and Market Units are granted on the date of award. RONA Units are granted annually in three equal tranches, beginning on the date of award. For fiscal 2022, the Stock Awards amounts include the aggregate grant date fair values of RSUs and Market Units granted in fiscal 2022 and the third tranche of RONA Units awarded in fiscal 2020 for the fiscal 2022 performance period. The dollar amounts shown for Stock Awards represent the aggregate grant date fair values calculated in accordance with ASC 718, Stock Compensation. See “Compensation Discussion and Analysis — Compensation Elements — Long-Term Equity-Based Compensation” for more information. The grant date fair value of the fiscal 2020, fiscal 2021 and fiscal 2022 Market Units was $14.94, $15.39 and $15.76, respectively. (3)“Option Awards” comprise stock options. All stock amounts for the awards represent the grant date fair value of stock options granted under the Stock Plan to each of the NEOs, calculated in accordance with ASC Topic 718. For more information regarding how the Company calculated these amounts, see the audited financial statements contained in our fiscal 2022 Form 10-K. The calculated compensation expense of the option awards recognized for financial reporting purposes will vary from the actual amount ultimately realized by the NEOs due to stock price fluctuations and timing factors related to the NEO’s realization of value from the option. To see the value actually received upon exercise of options by the NEOs in 2022, refer to the 2022 Option Exercises and Stock Vested table. Additional information on all outstanding option awards is reflected in the 2022 Outstanding Equity Awards table and the Grant of Plan-Based Awards Table” below. The dollar amount shown for Mr. Hall includes stock awards made to Mr. Hall as an offset for forfeited performance and equity awards under his prior employer’s incentive plans. See “Compensation Discussion and Analysis — Compensation Elements — Other Cash and Equity Awards” for more information. |
| |
(5) | Amounts reflect annual non-equity incentive plan compensation awards earned by our NEOs based on Company and segment financial performance and EHS-related objectives. The amounts earned for fiscal 2017 were paid in December 2017. See “Compensation Discussion and Analysis — Compensation Elements — Annual Cash Incentive Awards” for more information. |
| |
(6) | Amounts reflect accruals for deferred compensation for Mr. Hyland under a plan we established for his benefit. See “— Nonqualified Deferred Compensation During Fiscal Year 2017” below. |
| |
(7) | Amounts reflect the combined value of each NEO’s perquisites and compensation that is not otherwise reflected in the Summary Compensation Table. Amounts for fiscal 2017 are described in “— All Other Compensation” below. |
Table of Contentsthis Proxy Statement. See “Compensation Discussion and Analysis — Compensation Elements — Long-Term Equity-Based Compensation” for more information. The grant date fair value of the fiscal 2021 and fiscal 2022 stock options was $3.05 and $3.43, respectively.
(4)Amounts reflect annual non-equity incentive plan compensation awards earned by our NEOs based on Company financial performance along with and EHS-related objectives and segment performance, as applicable. The amounts earned for fiscal 2022 were paid in December 2022. See “Compensation Discussion and Analysis — Compensation Elements — Annual Cash Incentive Awards” for more information.
(5)Amounts reflect the combined value of each NEO’s perquisites and compensation that is not otherwise reflected in the Summary Compensation Table. Amounts for fiscal 2022 are described in “— Summary Compensation Table — All Other Compensation” below.
PROXY STATEMENT FOR 2023 ANNUAL MEETING 55
Summary Compensation Table - All Other Compensation
The following table provides additional detail regarding the amounts presented in the “All Other Compensation” column in the Summary Compensation Table for fiscal 2022.
| | | | | | | | | | | | | | | | | | | | |
| Name | Vehicle
Allowance
($) | Financial Planning(1) ($) | Contributions
to 401(k)
Plans
($) | Life and
Long-Term
Disability
Insurance
($) | Other(2) ($) | Total
($) |
| J. Scott Hall | 24,000 | | — | | 15,250 | | 17,623 | | | 56,873 | |
| Marietta Edmunds Zakas | 18,000 | | 7,500 | | 15,079 | | 10,341 | | 3,350 | | 54,270 | |
| Steven S. Heinrichs | 18,000 | | 1,320 | | 15,250 | | 8,591 | | 3,161 | | 46,322 | |
| Todd P. Helms | — | | 7,500 | | 14,835 | | 7,170 | | — | | 29,505 | |
| Kenji Takeuchi | — | | — | | 14,874 | | 4,633 | | | 19,507 | |
(1)2017NEOs are entitled to reimbursement of up to $7,500 for annual financial planning ($10,000 for the CEO).
(2)Other compensation for Ms. Zakas and Mr. Heinrichs consists of reimbursement of annual physical exam expenses. See “Compensation Discussion and Analysis — Compensation Elements — Other Cash and Equity Awards.”
|
| | | | | | | | | | | | |
| Name | Vehicle Allowance or Use of Leased Vehicle ($) | Financial Planning (1) ($) | Contributions to 401(k) Plans ($) | Life and Long-Term Disability Insurance ($) | Other(2) ($) | Total ($) |
| Gregory E. Hyland | 14,000 |
| 2,825 |
| 10,800 |
| 18,999 |
| 3,000 | 49,624 |
|
| Scott Hall | 17,000 |
| — |
| 10,800 |
| 3,739 |
| 76,656 | 108,195 |
|
| Evan L. Hart | 18,000 |
| — |
| 10,800 |
| 3,235 |
| — | 32,035 |
|
| Keith L. Belknap | 18,000 |
| 2,100 |
| 10,800 |
| 6,395 |
| 3,000 | 40,295 |
|
| Gregory S. Rogowski | 18,000 |
| — |
| 10,800 |
| 5,524 |
| 3,048 | 37,372 |
|
| Marietta Edmunds Zakas | 14,400 |
| 7,500 |
| 10,800 |
| 4,183 |
| — | 36,883 |
|
| |
(1)
| NEOs are entitled to reimbursement of up to $7,500 of annual financial planning ($10,000 for the CEO). |
| |
(2) | For Messrs. Hyland and Belknap, represents reimbursement of annual physical exam expenses. For Mr. Hall, represents relocation reimbursements and expenses. For Mr. Rogowski, represents the incremental cost to us of his spouse accompanying him on a sales incentive trip. |
Grants of Plan-Based Awards Table
The following table summarizes the equity awardsfiscal 2022 grants made to our NEOs during fiscal 2017on November 30, 2021 on a grant-by-grant basis. Each of the equity-based awards granted during fiscal 20172022 and reported in the following table was granted under, and is subject to the terms of, the 2006 Stock Plan. |
| | | | | | | | | | | | | | | | | |
| Fiscal 2017 Grants of Plan-Based Awards Table |
| | | | Estimated Possible Payouts Under Non-Equity Incentive Plan Awards (1) | Estimated Future Issuance of Shares Under Equity Incentive Plans (2) | All Other Stock-Based Awards (#) (3) | Grant Date Fair Value of Stock-Based Awards ($) (4) |
| Name | Grant Date | | Threshold ($) | Target ($) | Maximum ($) | Threshold (#) | Target (#) | Maximum (#) |
| Gregory E. Hyland | | | — | 301,736 |
| 603,472 |
| | | | | |
| | 11/29/2016 | | | | | | | | 75,414 |
| 999,990 |
|
| | 11/29/2016 | (5) | | | | 12,569 |
| 25,138 |
| 50,276 |
| | 333,330 |
|
| | 12/1/2015 | (5) | | | | 17,768 |
| 35,536 |
| 71,072 |
| | 471,207 |
|
| | 12/2/2014 | (5) | | | | 17,041 |
| 34,083 |
| 68,166 |
| | 451,941 |
|
| Scott Hall | | | — | 750,000 |
| 1,500,000 |
| | | | | |
| | 3/29/2017 | | | | | | | | 56,069 |
| 657,689 |
|
| | 1/23/2017 | | | | | | | | 57,034 |
| 749,997 |
|
| | 1/23/2017 | (5) | | | | 9,506 |
| 19,012 |
| 38,024 |
| | 250,008 |
|
| Evan L. Hart |
| | — | 310,325 |
| 620,650 |
| | | | | |
| | 11/29/2016 | | | | | | | | 21,493 |
| 284,997 |
|
| | 11/29/2016 | (5) | | | | 3,582 |
| 7,164 |
| 14,328 |
| | 94,995 |
|
| | 12/1/2015 | (5) | | | | 5,064 |
| 10,128 |
| 20,256 |
| | 134,297 |
|
| | 12/2/2014 | (5) | | | | 4,797 |
| 9,594 |
| 19,188 |
| | 127,216 |
|
| Keith L. Belknap |
| | — | 307,417 |
| 614,834 |
| | | | | |
| | 11/29/2016 | | | | | | | | 18,853 |
| 249,991 |
|
| | 11/29/2016 | (5) | | | | 3,142 |
| 6,284 |
| 12,568 |
| | 83,326 |
|
| | 12/1/2015 | (5) | | | | 4,442 |
| 8,884 |
| 17,768 |
| | 117,802 |
|
| | 12/2/2014 | (5) | | | | 3,408 |
| 6,816 |
| 13,632 |
| | 90,380 |
|
| Gregory S. Rogowski |
| | — | 331,250 |
| 662,500 |
| | | | | |
| | 11/29/2016 | | | | | | | | 21,568 |
| 285,992 |
|
| | 11/29/2016 | (5) | | | | 3,594 |
| 7,189 |
| 14,378 |
| | 95,326 |
|
| | 12/1/2015 | (5) | | | | 4,886 |
| 9,772 |
| 19,544 |
| | 129,577 |
|
| | 12/2/2014 | (5) | | | | 4,601 |
| 9,202 |
| 18,404 |
| | 122,019 |
|
| Marietta Edmunds Zakas |
| | — | 211,180 |
| 422,360 |
|
|
|
|
|
|
| |
|
|
| | 11/29/2016 | |
|
|
|
|
| | | | 15,082 |
| 199,987 |
|
| | 11/29/2016 | (5) |
|
|
|
|
| 2,513 |
| 5,027 |
| 10,054 |
| | 66,658 |
|
| | 12/1/2015 | (5) |
|
|
|
|
| 2,487 |
| 4,975 |
| 9,950 |
| | 65,969 |
|
| | 12/2/2014 | (5) |
|
|
|
|
| 2,300 |
| 4,601 |
| 9,202 |
| | 61,009 |
|
| | |
(1) | Amounts represent the range of possible cash payouts for fiscal 2017 awards under the annual cash incentive plan as described in “Compensation Discussion and Analysis — Compensation Elements — Annual Cash Incentive Awards”. The awards that were earned based on actual performance for fiscal 2017 were paid in December 2017 and are shown in the “Non-Equity Incentive Plan Compensation” column of the Summary Compensation Table.FISCAL 2022 GRANTS OF PLAN-BASED AWARDS TABLE |
| |
(2) | Represents PRSU awards that may be earned based on the achievement of performance goals in the 2017 performance period. See “Compensation Discussion and Analysis — Compensation Elements — Long-Term Equity-Based Compensation — Performance-Based Restricted Stock Units”. Estimated amounts that may be earned over the three-year award cycle of PRSUs granted for fiscal 2015, 2016 and 2017 are reflected in “Outstanding Equity Awards Table” below. |
| |
(3) | Represents time-vesting RSUs. Each RSU entitles the grantee to receive one share of Common Stock upon vesting. The RSUs generally vest in equal installments on the first, second and third anniversaries of the grant date. See “Compensation Discussion and Analysis — Compensation Elements — Long-Term Equity-Based Compensation — Time-Based Restricted Stock Units”. The RSUs granted to Mr. Hall on March 29, 2017 vest in full on January 23, 2018. See “Compensation Discussion and Analysis — Other Cash and Equity Awards” for more information. |
| |
(4) | See footnote 4 to the “Summary Compensation Table” for a description of the methods used to determine grant date fair value of equity-based awards. |
| |
(5) | Represents the range of shares of Common Stock that may vest after the end of the three-year award cycle applicable to a PRSU award solely with respect to the fiscal 2017 performance period, assuming achievement of threshold, target and maximum performance. |
| | | | | | | | | | | | | | | | | | | | | | | | | | | | | | | | | | | | | | | |
| | | | Estimated Possible Payouts
Under Non-Equity Incentive
Plan Awards | | Estimated Future Issuance
of Shares Under Equity
Incentive Plans | All Other
Option Awards:
Number of
Securities
Underlying
Options
(#) | Exercise or Base Price of Option Awards ($/Sh)(6) | All Other Stock-Based
Awards
(#) | Grant Date Fair Value of Stock-Based Awards ($)(7) |
| Name | Award Date | | Minimum
($) | Target
($) | Maximum
($) | | Threshold
(#) | Target
(#) | Maximum
(#) |
| J. Scott Hall | | (1) | — | | 886,438 | | 1,772,877 | | |
|
|
| | |
|
|
| 11/30/2021 | (2) | | | | | | | | | | 47,193 | | 643,713 | |
| 11/30/2021 | (3) | | | | | 47,196 | | 94,391 | | 188,782 | | | | | 1,487,602 | |
| 11/30/2021 | (4) | | | | | | | | 187,680 | | 13.64 | | | 643,742 | |
| 12/3/2019 | (5) | | | | | 12,433 | | 24,866 | | 49,732 | | | | | 339,172 | |
| Marietta Edmunds Zakas | | (1) | — | | 314,070 | | 628,141 | | |
|
|
| | |
|
|
| 11/30/2021 | (2) | | | | | | | | | | 12,015 | | 163,885 | |
| 11/30/2021 | (3) | | | | | 12,015 | | 24,030 | | 48,060 | | | | | 378,713 | |
| 11/30/2021 | (4) | | | | | | | | 47,778 | | 13.64 | | | 163,879 | |
| 12/3/2019 | (5) |
|
|
| | 3,671 | | 7,341 | | 14,682 | | | |
| 100,131 | |
| Steven S. Heinrichs | | (1) | — | | 272,515 | | 545,029 | | |
|
|
| | |
|
|
| 11/30/2021 | (2) | | | | | | | | | | 9,390 | | 128,080 | |
| 11/30/2021 | (3) | | | | | 9,393 | | 18,785 | | 37,570 | | | | | 296,052 | |
| 11/30/2021 | (4) | | | | | | | | 37,350 | | 13.64 | | 128,111 | |
| 12/3/2019 | (5) | | | | | 2,871 | | 5,742 | | 11,484 | | | | | 78,321 | |
| | | | | | | | | | | | | | | | | | | | | | | | | | | | | | | | | | | | | | | |
| | | | Estimated Possible Payouts
Under Non-Equity Incentive
Plan Awards | | Estimated Future Issuance
of Shares Under Equity
Incentive Plans | All Other
Option Awards:
Number of
Securities
Underlying
Options
(#) | Exercise or Base Price of Option Awards ($/Sh)(6) | All Other Stock-Based
Awards
(#) | Grant Date Fair Value of Stock-Based Awards ($)(7) |
| Name | Award Date | | Minimum
($) | Target
($) | Maximum
($) | | Threshold
(#) | Target
(#) | Maximum
(#) |
| Todd P. Helms | | (1) | — | | 220,602 | | 441,204 | | | | | | | | | |
| 11/30/2021 | (2) | | | | | | | | | | 6,573 | | 89,656 | |
| 11/30/2021 | (3) | | | | | 6,575 | | 13,149 | | 26,298 | | | | | 207,228 | |
| 11/30/2021 | (4) | | | | | | | | 26,145 | | 13.64 | | 89,677 | |
| 2/24/2020 | (8) | | | | | 1,922 | | 3,844 | | 7,688 | | | | | 52,432 | |
| Kenji Takeuchi | | (1) | — | | 185,031 | | 370,061 | | | | | | | | | |
| 11/30/2021 | (2) | | | | | | | | | | 6,606 | | 90,106 | |
| 11/30/2021 | (3) | | | | | 6,607 | | 13,214 | | 26,428 | | | | | 208,253 | |
| 11/30/2021 | (4) | | | | | | | | 26,274 | | 13.64 | | 90,120 | |
| 12/3/2019 | (5) | | | | | 1,776 | | 3,552 | | 7,104 | | | | | 48,449 | |
(1)Amounts represent the range of possible cash payouts for fiscal 2022 awards under the annual cash incentive plan as described in “Compensation Discussion and Analysis — Compensation Elements — Annual Cash Incentive Awards.” The amounts that were earned based on actual performance for fiscal 2022 were paid in December 2022 and are shown in the “Non-Equity Incentive Plan Compensation” column of the Summary Compensation Table.
(2)Represents time-based RSUs. Each RSU entitles the grantee to receive one share of Common Stock upon vesting. The RSUs generally vest in equal installments on the first, second and third anniversaries of the award date. See “Compensation Discussion and Analysis — Compensation Elements — Long-Term Equity-Based Compensation — Time-Based Restricted Stock Units” for more information.
(3)Represents the range of shares of Common Stock that may vest after the end of the three-year cumulative award period applicable to a PRSU award based solely on rTSR performance goals established in fiscal 2022, i.e., Market Units, assuming achievement of threshold, target and maximum performance. The grant date fair value of the fiscal 2022 Market Units was $15.76. See “Compensation Discussion and Analysis — Compensation Elements — Long-Term Equity-Based Compensation — Performance-Based Restricted Stock Units” for more information.
(4)Represents stock options. Upon vesting, each stock option entitles the NEO to purchase one share of our common stock at a specified exercise price. These stock options vest in equal installments on the first, second and third anniversary of the date of award. Once vested, options will generally remain exercisable until their normal expiration dates, which are ten years from the grant date. Grantees generally have ninety days to exercise any vested options upon termination of employment. This period is extended to one year in the event termination results from death and disability and two years in the case of retirement. All outstanding options will immediately terminate if the grantee is terminated for cause. The grant date fair value of the fiscal 2022 stock options was $3.43.
(5)Represents the range of shares of Common Stock that may vest after the end of the three-year award cycle applicable to a PRSU award solely with respect to the fiscal 2022 RONA performance period goals established in fiscal 2022, i.e., RONA Units, assuming achievement of threshold, target and maximum performance.
(6)Each stock option granted during fiscal 2022 was granted with a per-share exercise price equal to the closing price of the underlying common stock on the New York Stock Exchange on the award date.
(7)See footnote 2 and footnote 3 to the “Summary Compensation Table” for a description of the methods used to determine grant date fair value of equity-based awards.
(8)Mr. Helms received an award commensurate with his position and in line with awards granted to the then-current senior officers of the Company at the time of his hiring. This row represents the range of shares of Common Stock that may vest after the end of the three-year award cycle applicable to a PRSU award solely with respect to the fiscal 2022 RONA performance period goals established in fiscal 2022, i.e., RONA Units, assuming achievement of threshold, target and maximum performance.
PROXY STATEMENT FOR 2023 ANNUAL MEETING 57
Outstanding Equity Awards Table
The following table sets forth information detailing the outstanding unexercised options and unvested RSUs and PRSUs held by each of our NEOs at September 30, 2017.2022.
| | | | | | | | | | | | | | | | | | | | | | | | | | | | | | | | | | | |
|
| | Option Awards |
| Stock Awards |
|
| | Number of Securities
Underlying Options
(#) | Option Exercise Price ($)(1) | Option
Expiration
Date |
| Number of RSUs That Have Not Vested (#)(2) | Market Value of RSUs That Have Not Vested ($)(3) | Number of Performance Units That Have Not Vested (#)(4) | Market Value of Performance Units That Have Not Vested ($)(3) |
| Name | Award Date | Exercisable | Unexercisable |
|
| J. Scott Hall | 12/03/19 | (5) |
|
|
|
|
| 18,650 | | 191,536 | | | |
| 12/02/20 | (6) | | | | | | 32,672 | | 335,541 | | | |
| 12/02/20 | (7) | | | | | | | | 98,018 | | 1,006,645 | |
| 12/02/20 | (8) | 59,070 | | 118,140 | | 11.86 | | 12/02/30 | | | | | |
| 11/30/21 | (9) | | | | | | 47,193 | | 484,672 | | | |
| 11/30/21 | (10) | | | | | | | | 94,391 | | 969,396 | |
| 11/30/21 | (11) | — | | 187,680 | | 13.64 | | 11/29/31 | | | | | |
| Marietta Edmunds Zakas | 12/03/19 | (5) |
|
|
|
|
| 5,506 | | 56,547 | | | |
| 12/02/20 | (6) | | | | | | 8,944 | | 91,855 | | | |
| 12/02/20 | (7) | | | | | | | | 26,834 | | 275,585 | |
| 12/02/20 | (8) | 16,171 | | 32,342 | | 11.86 | | 12/02/30 | | | | | |
| 11/30/21 | (9) | | | | | | 12,015 | | 123,394 | | | |
| 11/30/21 | (10) | | | | | | | | 24,030 | | 246,788 | |
| 11/30/21 | (11) | — | | 47,778 | | 13.64 | | 11/29/31 | | | | | |
| Steven S. Heinrichs | 12/03/19 | (5) | | | | | | 4,307 | | 44,233 | | | |
| 12/02/20 | (6) | | | | | | 7,026 | | 72,157 | | | |
| 12/02/20 | (7) | | | | | | | | 21,079 | | 216,481 | |
| 12/02/20 | (8) | 12,703 | | 25,406 | | 11.86 | | 12/02/30 | | | | | |
| 11/30/21 | (9) | | | | | | 9,390 | | 96,435 | | | |
| 11/30/21 | (10) | | | | | | | | 18,785 | | 192,922 | |
| 11/30/21 | (11) | — | | 37,350 | | 13.64 | | 11/29/31 | | | | | |
| Todd P. Helms | 02/24/20 | (5) | | | | | | 2,883 | | 29,608 | | | |
| 12/02/20 | (6) | | | | | | 4,918 | | 50,508 | | | |
| 12/02/20 | (7) | | | | | | | | 14,755 | | 151,534 | |
| 12/02/20 | (8) | 8,892 | | 17,784 | | 11.86 | | 12/02/30 | | | | | |
| 11/30/21 | (9) | | | | | | 6,573 | | 67,505 | | | |
| 11/30/21 | (10) | | | | | | | | 13,149 | | 135,040 | |
| 11/30/21 | (11) | — | | 26,145 | | 13.64 | | 11/29/31 | | | | | |
| Kenji Takeuchi | 12/03/19 | (5) | | | | | | 2,664 | | 27,359 | | | |
| 12/02/20 | (6) | | | | | | 4,214 | | 43,278 | | | |
| 12/02/20 | (7) | | | | | | | | 12,647 | | 129,885 | |
| 12/02/20 | (8) | 7,621 | | 15,242 | | 11.86 | | 12/02/30 | | | | | |
| 11/30/21 | (9) | | | | | | 6,606 | | 67,844 | | | |
| 11/30/21 | (10) | | | | | | | | 13,214 | | 135,708 | |
| 11/30/21 | (11) | — | | 26,274 | | 13.64 | | 11/29/31 | | | | | |
(1)Option exercise prices are equal to the closing price of Common Stock on the NYSE on the respective grant dates.
(2)This column includes unvested RSUs. RSUs vest in equal installments on the first, second and third anniversaries of the respective award dates.
(3)Market value for units in this column is calculated by multiplying the number of RSUs or PRSUs that have not vested by the closing price of Common Stock on the NYSE on September 30, 2022 of 10.27 per share, the last trading day of the fiscal year.
(4)This column includes unvested performance units based upon the applicable performance metric specified.
|
| | | | | | | | | | | | | | | | | | |
| Name | | | Option Awards | Stock Awards |
Grant Date | Number of Securities Underlying Options (#) | Option Exercise Price ($) (1) | Option Expiration Date | Number of Units of Stock That Have Not Vested (#) (2) | Market Value of Units of Stock That Have Not Vested ($) (3) | Number of Performance Shares That Have Not Vested (#) | Market Value of Performance Shares That Have Not Vested ($) (3) |
| Exercisable | | Unexercisable |
Gregory E. Hyland (6) | 11/29/07 | | 226,757 |
| | — |
| 10.66 |
| 11/29/17 | — |
| — |
| — |
| — |
|
| | 12/02/08 | | 343,155 |
| | — |
| 5.49 |
| 12/02/18 | — |
| — |
| — |
| — |
|
| | 12/01/09 | | 154,427 |
| | — |
| 5.05 |
| 12/01/19 | — |
| — |
| — |
| — |
|
| | 12/01/15 | (4) | | | | | | — |
| — |
| 35,536 |
| 454,861 |
|
| | 11/29/16 | (5) | | | | | | 75,414 |
| 965,299 |
| 50,276 |
| 643,533 |
|
| Scott Hall | 01/23/17 | (5) |
|
| |
|
|
|
|
| 57,034 |
| 730,035 |
| 57,034 |
| 730,035 |
|
| | 03/29/17 | |
|
|
|
|
|
|
|
| 56,069 |
| 717,683 |
|
|
|
|
|
| Evan L. Hart | 11/29/07 | | 10,459 |
| | — |
| 10.66 |
| 11/29/17 | — |
| — |
| — |
| — |
|
| | 07/31/08 | | 24,752 |
| | — |
| 9.10 |
| 07/31/18 | — |
| — |
| — |
| — |
|
| | 12/02/08 | | 66,539 |
| | — |
| 5.49 |
| 12/02/18 | — |
| — |
| — |
| — |
|
| | 12/01/09 | | 84,615 |
| | — |
| 5.05 |
| 12/01/19 | — |
| — |
| — |
| — |
|
| | 11/30/10 | | 84,615 |
| | — |
| 3.52 |
| 11/30/20 | — |
| — |
| — |
| — |
|
| | 11/29/11 | | 71,942 |
| | — |
| 2.03 |
| 11/29/21 | — |
| — |
| — |
| — |
|
| | 12/02/14 | | | | | | | 9,594 |
| 122,803 |
| — |
| — |
|
| | 12/01/15 | (4) | | | | | | 20,255 |
| 259,264 |
| 30,595 |
| 391,616 |
|
| | 11/29/16 | (5) | | | | | | 21,493 |
| 275,110 |
| 21,493 |
| 275,110 |
|
| Keith L. Belknap | 04/02/12 | | 22,335 |
| | — |
| 3.54 |
| 04/02/22 | — |
| — |
| — |
| — |
|
| | 12/02/14 | | | | | | | 6,816 |
| 87,245 |
| — |
| — |
|
| | 07/27/15 | | | | | | | 9,502 |
| 121,626 |
| — |
| — |
|
| | 12/01/15 | (4) | | | | | | 17,768 |
| 227,430 |
| 26,838 |
| 343,526 |
|
| | 11/29/16 | (5) | | | | | | 18,853 |
| 241,318 |
| 18,853 |
| 241,318 |
|
| Gregory S. Rogowski | 12/01/09 | | 85,839 |
| | — |
| 5.05 |
| 12/01/19 | — |
| — |
| — |
| — |
|
| | 11/30/10 | | 85,839 |
| | — |
| 3.52 |
| 11/30/20 | — |
| — |
| — |
| — |
|
| | 11/29/11 | | 70,684 |
| | — |
| 2.03 |
| 11/29/21 | — |
| — |
| — |
| — |
|
| | 12/02/14 | | | | | | | 9,202 |
| 117,786 |
| — |
| — |
|
| | 12/01/15 | (4) | | | | | | 19,544 |
| 250,163 |
| 29,522 |
| 377,882 |
|
| | 11/29/16 | (5) | | | | | | 21,568 |
| 276,070 |
| 21,568 |
| 276,070 |
|
| Marietta Edmunds Zakas | 11/29/07 | | 22,676 |
| | — |
| 10.66 |
| 11/29/17 | — |
| — |
| — |
| — |
|
| | 12/02/08 | | 38,022 |
| | — |
| 5.49 |
| 12/02/18 | — |
| — |
| — |
| — |
|
| | 12/01/09 | | 34,965 |
| | — |
| 5.05 |
| 12/01/19 | — |
| — |
| — |
| — |
|
| | 11/30/10 | | 34,965 |
| | — |
| 3.52 |
| 11/30/20 | — |
| — |
| — |
| — |
|
| | 11/29/11 | | 25,260 |
| | — |
| 2.03 |
| 11/29/21 | — |
| — |
| — |
| — |
|
| | 12/02/14 | | | | | | | 4,601 |
| 58,893 |
| — |
| — |
|
| | 12/01/15 | (4) |
|
| |
|
|
|
| | 9,950 |
| 127,360 |
| 15,029 |
| 192,371 |
|
| | 11/29/16 | (5) | | | | | | 15,082 |
| 193,050 |
| 15,082 |
| 193,050 |
|
58 MUELLER WATER PRODUCTS, INC.
| |
(1) | Option exercise prices are equal to the closing price of Common Stock on the NYSE on the respective grant dates. |
| |
(2) | RSUs granted on 12/02/14, 7/27/15, 12/01/15, 11/29/16 and 1/23/17 each vest in equal installments on the first, second and third anniversaries of the respective grant dates. RSUs granted on 03/29/17 vest in full on 1/23/18. |
| |
(3) | “Market value” is calculated by multiplying the number of RSUs or PRSUs that have not vested by the closing price of Common Stock on the NYSE on September 30, 2017 of $12.80 per share. |
| |
(4) | Includes PRSUs awarded in fiscal 2016 for a three-year award cycle (fiscal 2016 through fiscal 2018). The PRSUs shown are based on actual performance for fiscal 2016 and 2017 and assume target performance for fiscal 2018. Actual performances for fiscal 2016 and 2017 were 102.1% and 100% of target, respectively. See “Compensation Discussion and Analysis — Compensation Elements — Long-Term Equity-Based Compensation — Performance-Based Restricted Stock Units”. |
| |
(5) | Includes PRSUs awarded in fiscal 2017 for a three-year award cycle (fiscal 2017 through fiscal 2019). The PRSUs shown are based on actual performance for fiscal 2017 and assume target performance for fiscal 2018 and 2019. Actual performance for fiscal 2017 was 100% of target. See “Compensation Discussion and Analysis — Compensation Elements — Long-Term Equity-Based Compensation — Performance-Based Restricted Stock Units”. |
| |
(6) | Mr. Hyland is “retirement-eligible” under the terms and for purposes of the 2006 Stock Plan. Accordingly, for purposes of this table, all of his outstanding equity-based awards (other than unearned and outstanding PRSUs) are deemed vested. |
(5)This row includes RSUs awarded in fiscal 2020 in accordance with the Stock Plan.
(6)This row includes RSUs awarded in fiscal 2021 in accordance with the Stock Plan.
(7)This row includes Market Units awarded in fiscal 2021 for a cumulative three-year award cycle (fiscal 2021 through fiscal 2023). The PRSUs shown assume target performance for the award cycle. See “Compensation Discussion and Analysis — Compensation Elements — Long-Term Equity-Based Compensation — Performance-Based Restricted Stock Units.”
(8)This row includes unexercised stock options awarded in fiscal 2021. Stock options vest in equal installments on the first, second and third anniversaries of the respective grant dates.
(9)This row includes RSUs awarded in fiscal 2022 in accordance with the Stock Plan.
(10)This row includes Market Units awarded in fiscal 2022 for a three-year award cycle (fiscal 2022 through fiscal 2024) in accordance with the Stock Plan. The PRSUs shown assume target performance for the award cycle. See “Compensation Discussion and Analysis — Compensation Elements — Long-Term Equity-Based Compensation — Performance-Based Restricted Stock Units.”
(11)This row includes unexercised stock options awarded in fiscal 2022. Stock options vest in equal installments on the first, second and third anniversaries of the respective award dates.
Option Exercises and Stock Vested Table
The following table shows stock options exercised and RSUs and PRSUs vested during fiscal 2017.2022.
| | | | | | | | | | | | | | | | | | | | | | | | | | |
| Option Awards | | RSU Awards | | PRSU Awards(3) |
| Name | Number of
Shares
Acquired
on Exercise | Value Realized on Exercise(1) ($) |
| Number of
Shares
Acquired
on Vesting
(#) | Value Realized on Vesting(2) ($) |
| Number of
Shares
Acquired
on Vesting
(#) | Value Realized on Vesting(2) ($) |
| J. Scott Hall | — | | — | |
| 53,979 | | 751,589 | |
| 118,617 | | 1,218,197 | |
| Marietta Edmunds Zakas | — | | — | |
| 15,676 | | 218,276 | |
| 35,016 | | 359,614 | |
| Steven S. Heinrichs | — | | — | |
| 12,331 | | 171,705 | |
| 27,390 | | 281,295 | |
| Todd P. Helms | — | | — | |
| 25,110 | | 314,220 | |
| 15,916 | | 163,457 | |
| Kenji Takeuchi | — | | — | |
| 4,771 | | 66,140 | |
| 16,941 | | 173,984 | |
|
| | | | | | | | |
| Option Awards | Stock Awards |
| Name | Number of Shares Acquired on Exercise | Value Realized on Exercise(1) ($) | Number of Shares Acquired on Vesting | Value Realized on Vesting(2) ($) |
| Gregory E. Hyland | 500,000 |
| 4,685,686 |
| 108,743 |
| 1,437,163 |
|
| Scott Hall | — |
| — |
| — |
| — |
|
| Evan L. Hart | — |
| — |
| 30,735 |
| 406,205 |
|
| Keith L. Belknap | — |
| — |
| 33,027 |
| 420,183 |
|
| Gregory S. Rogowski | — |
| — |
| 29,538 |
| 390,388 |
|
| Marietta Edmunds Zakas | — |
| — |
| 13,977 |
| 184,755 |
|
| |
(1) | (1)Calculated by subtracting the exercise price of the option from the closing price of Common Stock on the NYSE on the exercise date, multiplied by the number of options exercised. |
| |
(2) | Calculated as the closing price of Common Stock on the NYSE on the vesting date multiplied by the number of RSUs that vested. |
Nonqualified Deferred Compensation During Fiscal 2017
Mr. Hyland participates in a deferred compensation plan pursuant to the terms of his employment agreement. None of our other NEOs participate in any executive deferred compensation plan. Mr. Hyland accumulated aggregate earnings from interest in fiscal 2017 of $19,754 and held an aggregate balance on September 30, 2017 of $663,814. These contributions and aggregate earnings are reflected in the “Change in Pension Value and Nonqualified Deferred Compensation Earnings” column of the Summary Compensation Table.option from the actual trade value of the share on exercise, multiplied by the number of options exercised.
(2)Calculated as the closing price of Common Stock on the NYSE on the vesting date multiplied by the number of RSUs or PRSUs that vested. (3)Consists of RONA Units and Market Units.
Pension Plan
None of our NEOs participate in a defined benefit pension plan. Each NEO participates in our 401(k) plan, under which we make matching contributions in accordance with the terms of that plan.
PROXY STATEMENT FOR 2023 ANNUAL MEETING 59
Employment, Severance and Change-in-Control Arrangements
At September 30, 2017,2022, we maintained employment agreements with each NEO.NEO except as noted. Each agreement (other than Mr. Hyland’s agreement) provides for an annual equity opportunity, which is subject to the discretion of the Compensation Committee, and commensurate with their executive-level position. Each agreement also entitles the employee to receive reimbursement for financial planning services and the cost of an annual physical exam. The following table sets forth certain information with respect to these agreements.
| | | | | | | | | | | | | | | | | |
| Name | Base Salary Rate(1) ($) | Annual Target Bonus as Percent of Base Salary(2) (%) | Monthly Car
Allowance
($) | Annual
Vacation | Severance Benefits as Percent of Salary(3) (%) |
| J. Scott Hall | 854,000 | | 105 | | 2,000 | | 4 weeks | 300.0 | |
| Marietta Edmunds Zakas | 454,564 | | 70 | | 1,500 | | 4 weeks | 262.5 | |
| Steven S. Heinrichs | 459,426 | | 60 | | 1,500 | | 4 weeks | 262.5 | |
Todd P. Helms(4) | 372,203 | | 60 | | N/A | 4 weeks | 100.0 | |
Kenji Takeuchi(4) | 374,920 | | 50 | | N/A | 4 weeks | 100.0 |
|
| | | | | | | |
| Name | Base Salary Rate(1) ($) | Annual Target Bonus as Percent of Base Salary(2) (%) | Monthly Car Allowance ($) | Annual Vacation | Severance Benefits as Percent of Salary(3) (%) |
Gregory E. Hyland(4) | 1,000,000 |
| N/A | — |
| 4 weeks | N/A |
| Scott Hall | 750,000 | 100 | 2,000 |
| 4 weeks | 300.0 |
| Evan L. Hart | 418,000 |
| 75 | 1,500 |
| 4 weeks | 262.5 |
| Keith L. Belknap | 443,500 |
| 70 | 1,500 |
| 4 weeks | 240.0 |
| Gregory S. Rogowski | 446,000 |
| 75 | 1,500 |
| 4 weeks | 262.5 |
| Marietta Edmunds Zakas | 357,000 |
| 60 | 1,200 |
| 4 weeks | 225.0 |
| |
(1) | (1)Salaries are reviewed annually. Amounts shown represent annual salary rates as of September 30, 2017. |
| |
(2) | Payout can range from zero to up to twice the amount of the target based on the satisfaction of predetermined financial, operational and individual performance objectives. Mr. Hyland’s 2017 bonus was based on his salary in effect, and performance achieved, during the period in which he served as President and Chief Executive Officer (from October 2016 through January 2017). |
| |
(3) | Severance benefits under Mr. Hyland’s agreement are equal to the amount of salary unpaid from the date of termination through January 2018. Cash severance to Mr. Hyland would also include payout under the Retirement Plan. See “— Nonqualified Deferred Compensation During Fiscal 2017”. Other severance benefits are paid in monthly installments over 24 months, in the case of Mr. Hall, and over 18 months in the case of each other NEO, together with a lump sum payment of unpaid salary and other benefits. |
(2)Payout can range from zero to up to twice the amount of the target based on the satisfaction of predetermined financial, market and operational performance objectives.
| |
(4) | Mr. Hyland participates in an unfunded deferred compensation plan. See “— Nonqualified Deferred Compensation During Fiscal 2017”. |
(3)Other severance benefits are paid in monthly installments over 24 months, in the case of Mr. Hall, and over 18 months in the case of each other NEO, together with a lump sum payment of unpaid salary and other benefits. Potential Payments Upon Termination or Change-in-Control(4)Messrs. Helms and Takeuchi are subject to the Company's executive severance plan and do not maintain separate employment agreements.
At September 30, 2017,2022, we also maintained change-in-control arrangements with each NEO. Under the existing change-in-control agreements with each NEO (other than Mr. Hyland). The following table sets forth certain information with respect to these agreements.
Under these agreements,Messrs. Hall and Heinrichs and Ms. Zakas, upon a change-in-control (as defined in the agreement) of Mueller Water Products, Inc.the Company and (i) the executive’s employment is terminated other than for Cause or for Good Reason (each as defined in the agreement) within 24 months following a change-in-control or (ii) a replacement award (as defined in the agreement) was not available (i.e., a double trigger), all outstanding options and RSUs would immediately vest. The value of PRSUs reflects the pro rata portion of shares earned during the performance period and payout at target for future performance periods within the award cycle. In addition, if the executive’s employment is terminated other than for Cause or for Good Reason (each as defined in the agreement) within 24 months following a change-in-control, the executive would be entitled to a lump-sum severance payment equivalent to 2.0x base salary and annual incentive bonus (generally calculated as the greater of (i) the Executive’s annual target bonus and (ii) the average of actual annual incentive bonuses over the preceding three years) and continuation of certain benefits, such as group life and medical insurance coverage for a period of 24 months. The agreements for Messrs. Rogowski and Hart and Ms. Zakas provide for an additional payment sufficient to eliminate the effect of any applicable excise tax on severance payments in excess of any amount determined under 280G of the Code. We would not be able to deduct payments subject to the excise tax for federal and state income tax purposes. The agreements for Messrs. Hall and Belknapalso contain a “best-of-net” provision, so that, in the event excise taxes would be imposed on payments under the agreements, Messrs. Hall and Belknapthe NEO will either (1) pay the excise tax without assistance from the Company or (2) have the payments reduced to an amount at which an excise tax would no longer be payable, based on which result is more favorable to him or her on an after-tax basis.
Messrs. Helms and Takeuchi receive change-in-control benefits under the executive severance plan. The executive severance plan provides, upon a change-in-control, for vesting of outstanding equity-based awards if a replacement award (as defined in the Executive Severance Plan) is not available and for payment of cash severance amounts if the NEO’s employment is involuntarily terminated (other than for Cause or for termination for Good Reason as defined in the executive severance plan) within 24 months following a change-in-control (i.e., a double trigger). Such cash severance payments would include a lump-sum payment equivalent to the sum of 1.0x base salary and annual target incentive bonus, a pro rata amount of his annual target incentive bonus (prorated based upon the time of service during the applicable fiscal year) and cash equivalent amounts related to other benefits.
60 MUELLER WATER PRODUCTS, INC.
Potential Payments Upon Termination or Change-in-Control
The following table sets forth the potential benefits each NEO would be entitled to receive upon termination of employment in the situations outlined below. The NEO would not be entitled to the severance benefits described below if he or she terminates employment without Good Reason or is terminated for Cause. The amounts shown are estimates and do not necessarily reflect the actual amounts that would be paid to the NEOs, which would only be known at the time they become eligible for payment. The amounts shown are the amounts that could be payable under existing plans and arrangements if the NEO’s employment had terminated on September 30, 2017, including (other than for Messrs. Hall and Belknap), an estimated gross-up for excise taxes in the event that any payments made in connection with a change-in-control were subject to such taxes.
2022.
The termination events pursuant to which the NEOs are entitled to potential payments are as follows:
A - Severance arrangement for termination without causeCause or for good reasonGood Reason
B - Termination without causeCause after a change-in-control or, if applicable, sale of segment
C - Death, disability or retirement
| | | | | | | | | | | | | | | | | | | | | | | | | | | | | | | | |
| POTENTIAL PAYMENTS UPON TERMINATION OR CHANGE-IN-CONTROL TABLE |
| | | | | | | | | | | |
| Name |
| Cash Severance
($) | Bonus Earned as of Event Date(1) ($) | Vesting of Unvested Long-Term Awards(2) ($) | Health, Welfare and Other Benefits Continuation(3) ($) | Outplacement(4) ($) | Total
($) |
| J. Scott Hall | A | 2,627,692 | | (5) | 791,767 | | — | | | 45,008 | | | 25,000 | | 3,489,467 | |
| B | 3,546,568 | | (6) | 791,767 | | 2,987,789 | | | 90,547 | | | 298,900 | | 7,715,571 | |
| C | — | | | — | | 2,987,789 | | | — | | | — | | 2,987,789 | |
| Marietta Edmunds Zakas | A | 1,228,197 | | (5) | 280,528 | | — | | | 60,094 | | | 25,000 | | 1,593,819 | |
| B | 1,575,684 | | (6) | 280,528 | | 794,169 | | | 133,804 | | | 159,097 | | 2,943,282 | |
| C | — | | | — | | 794,169 | | | — | | | — | | 794,169 | |
| Steven S. Heinrichs | A | 1,241,333 | | (5) | 243,410 | | — | |
| 1,697 | | | 25,000 | | 1,511,440 | |
| B | 1,506,334 | | (6) | 243,410 | | 622,228 | | | 130,690 | | | 160,799 | | 2,663,461 | |
| C | — | | | — | | 622,228 | | | — | | | — | | 622,228 | |
| Todd P. Helms | A | 597,875 | | (5) | 197,041 | | — | | | 25,900 | | | 25,000 | | 845,816 | |
| B | 621,436 | | (6) | 197,041 | | 434,195 | | | 25,900 | | | 25,000 | | 1,303,572 | |
| C | — | | | — | | 434,195 | | | — | | | — | | 434,195 | |
| Kenji Takeuchi | A | 572,119 | | (5) | 168,359 | | — | | | 24,256 | | | 25,000 | | 789,734 | |
| B | 588,791 | | (6) | 168,359 | | 404,073 | | | 24,256 | | | 25,000 | | 1,210,479 | |
| C | — | | | — | | 404,073 | | | — | | | — | | 404,073 | |
(1)Each is entitled to a pro rata share of the current fiscal year bonus in the event of termination without Cause or after a change-in-control. Amounts in this table assume a termination date of September 30, 2022 and represent the actual bonus paid for fiscal 2022 since this amount would not have otherwise been paid at that date.
(2)The value of stock options is the difference between the closing price of Common Stock on September 30, 2022 and the option exercise prices per share multiplied by the number of options. The value of RSUs is the closing price of Common Stock on September 30, 2022 multiplied by the number of RSUs. The value of PRSUs reflects the pro rata portion of shares earned during the performance period and payout at target for future performance periods within the award cycle. The closing price of our Common Stock on September 30, 2022 on the NYSE was $10.27.
(3)For all NEOs, excluding Messrs. Helms and Takeuchi, health and welfare benefits are continued for up to 42 months from the separation date based on the current elections and plan premiums.
(4)Services in Case A (without Cause termination) will be reasonable in our sole discretion. Services in Case B (change-in-control termination) will be provided for up to two years but will not exceed 35% of the base salary at the time of termination for Messrs. Hall and Heinrichs and Ms. Zakas or $25,000 for Messrs. Helms and Takeuchi.
(5)Cash severance in Case A (without Cause termination) is equal to a percentage of current annual base salary plus accrued vacation. The percentage applicable to Mr. Hall is 300%. The percentage applicable to Mr. Heinrichs and Ms. Zakas is 262.5%. The percentage applicable to Messrs. Helms and Takeuchi is 100% plus an amount equal to a pro rata annual incentive bonus calculated at target goals. Other severance benefits, if applicable, are paid in monthly installments over 24 months in the case of Mr. Hall and over 18 months in the case of each other NEO, together with a lump sum payment of unpaid salary and other benefits.
PROXY STATEMENT FOR 2023 ANNUAL MEETING 61
|
| | | | | | | | | | | | | | | | | |
| Potential Payments Upon Termination or Change-in-Control Table |
| Name | | Cash Severance ($) | | Bonus Earned as of Event Date(1) ($) | Vesting of Unvested Long-Term Awards(2) ($) | Health, Welfare and Other Benefits Continuation(3) ($) | | Outplacement(4) ($) | | Sec 280G Excise Tax and Related Gross-Up(5) ($) | Total ($) |
| Scott Hall | A | 2,307,692 |
| (6) | 908,925 |
| — |
| 27,276 |
| | 25,000 |
|
| 0 | 3,268,893 |
|
| | B | 3,057,692 |
| (7) | 908,925 |
| 2,177,753 |
| 36,368 |
| | 262,500 |
|
| 0 | 6,443,238 |
|
| | C | — |
|
| — |
| 1,691,059 |
| — |
|
| — |
|
| 0 | 1,691,059 |
|
| Evan L. Hart | A | 1,129,404 |
| (6) | 376,083 |
| — |
| 12,867 |
| | 25,000 |
| | 0 | 1,543,354 |
|
| | B | 1,404,457 |
| (7) | 376,083 |
| 1,323,927 |
| 17,156 |
| | 146,300 |
| | 0 | 3,267,923 |
|
| | C | — |
| | — |
| 1,010,881 |
| — |
| | — |
| | 0 | 1,010,881 |
|
| Keith L. Belknap | A | 1,098,515 |
| (6) | 226,627 |
| — |
| 30,798 |
|
| 25,000 |
| | 0 | 1,380,940 |
|
| | B | 1,238,441 |
| (7) | 226,627 |
| 1,262,474 |
| 41,064 |
| | 155,225 |
| | 0 | 2,923,831 |
|
| | C | — |
| | — |
| 987,881 |
| — |
| | — |
| | 0 | 987,881 |
|
| Gregory S. Rogowski | A | 1,205,058 |
| (6) | 282,075 |
| — |
| 7,803 |
|
| 25,000 |
| | 0 | 1,519,936 |
|
| B | 1,526,060 |
| (7) | 282,075 |
| 1,297,971 |
| 10,405 |
| | 156,100 |
| | 0 | 3,272,611 |
|
| | C | — |
| | — |
| 988,842 |
| — |
| | — |
| | 0 | 988,842 |
|
| Marietta Edmunds Zakas | A | 830,712 |
| (6) | 255,929 |
| — |
| 26,093 |
| | 25,000 |
| | 0 | 1,137,734 |
|
| B | 1,082,756 |
| (7) | 255,929 |
| 764,724 |
| 34,791 |
| | 124,950 |
| | 0 | 2,263,150 |
|
| | C | — |
| | — |
| 572,344 |
| — |
| | — |
| | 0 | 572,344 |
|
CEO Pay Ratio Disclosure
For fiscal 2022, (i) the annual total compensation of our median employee (excluding our CEO) was $60,507 and (ii) the annual total compensation of our CEO was $4,807,096. Based on this information, the ratio of the annual total compensation of our CEO to that of the median employee is approximately 79 to 1. Our employee population consists of approximately 3,545 employees located throughout the world, with approximately 81% in the United States.
To identify the median employee for fiscal 2022, we included all part-time and full-time employees that were employed for any portion of fiscal 2022 so long as they were still actively employed on September 30, 2022. Compensation elements used included regular pay (base salary for exempt population and hourly wages for non-exempt population), bonuses, overtime, shift pay and paid time off. Commissions and executive perquisites were omitted from the median employee selection calculation. Using this methodology, we determined the “median employee” was a full-time, hourly employee located in the United States.
ADVISORY VOTE ON FREQUENCY OF ADVISORY VOTE TO APPROVE EXECUTIVE COMPENSATION | | | | | |
(1)Proposal Three |
Each is entitled to a pro rata shareAdvisory Vote on the Frequency of the current fiscal year bonus in the event of termination without Cause or after a change-in-control. Amounts in this table assume a termination date of September 30, 2017 and represent the actual bonus paid for fiscal 2017 since this amount would not have otherwise been paid at that date.Advisory Vote to Approve Executive Compensation |
| The Board recommends voting on executive compensation ANNUALLY. |
At our 2011 Annual Meeting, we first provided our stockholders with the opportunity to cast an advisory vote on how frequently they would like to vote on our executive compensation, which, as described in Proposal Two, is commonly referred to as “Say-on-Pay.” Based on the previous voting results, our Board determined to hold Say-on-Pay votes annually. SEC rules require us to ask our stockholders, at least every six years, how often they would like for us to hold Say-on-Pay votes. Accordingly, we are requesting your advisory vote this year to determine the frequency of future Say-on-Pay votes.
By voting on this Proposal Three, stockholders may indicate whether they would prefer that we continue to hold an advisory vote on our executive compensation annually, or whether they prefer such vote to be held every two or three years.
The Board believes that an annual vote is the most effective means for ensuring that our executive compensation policies and procedures are strongly aligned with the interests of our stockholders and are effective in implementing our compensation philosophy and in achieving our strategic goals. The Board’s belief is further based on the premise that this recommendation can be modified in future years if it becomes apparent that a vote once every year is not meaningful or a different voting frequency is recommended by best corporate governance practices.
Accordingly, we ask for stockholder approval of the following resolution:
RESOLVED, that the stockholders approve, on an advisory basis, an annual advisory vote on executive compensation.
This vote is advisory and therefore not binding on us, the Board or the Compensation Committee. The Compensation Committee will consider the result of this year’s vote, as well as other communications from stockholders relating to our compensation practices, and take them into account in future determinations concerning our executive compensation programs.
62 MUELLER WATER PRODUCTS, INC.
RATIFICATION OF APPOINTMENT OF REGISTERED PUBLIC ACCOUNTING FIRM | | | | | |
(2)Proposal Four |
| Ratification of the Appointment of Our Independent Registered Public Accounting Firm for Fiscal 2023 |
| The value of stock options is calculated as the difference between the closing price of Common Stock on September 30, 2017 and the option exercise prices per share multiplied by the number of in-the-money options. The value of RSUs is the closing price of Common Stock on September 30, 2017 multiplied by the number of RSUs. The value of PRSUs reflects the pro rata portion of shares earned during the performance period and payout at target for future performance periods within the award cycle. The closing price of our common stock on September 30, 2017 on the NYSE was $12.80.Board recommends a vote FOR this proposal. |
The Audit Committee has authority to retain and terminate the services of our independent registered public accounting firm. The Audit Committee has appointed Ernst & Young LLP (“EY”) as the independent registered public accounting firm to audit our consolidated financial statements and internal control over financial reporting for the fiscal year ending September 30, 2023, subject to negotiation of definitive fee arrangements. Although stockholder ratification of EY’s appointment is not required, the Board believes submitting the appointment to our stockholders for ratification is a matter of good corporate governance. Even if stockholders ratify the appointment of EY, the Audit Committee, in its discretion, may change the appointment at any time during the fiscal year if it determines that a change would be in the best interest of the Company and its stockholders.
See below for a description of the fees EY billed us for fiscal 2022 and fiscal 2021.
A representative of EY is expected to be present at the Annual Meeting. The representative will have an opportunity to make a statement and will be available to respond to stockholder questions.
Fees and Services of the Independent Registered Public Accounting Firm
The Audit Committee appointed Ernst & Young as the independent registered public accounting firm to audit our consolidated financial statements and internal control over financial reporting for fiscal 2022.
Audit Fees and Other Fees
The following table shows the approximate fees for audit and other services provided by Ernst & Young for fiscal years 2022 and 2021 (in millions). All fees in 2022 and 2021 were pre-approved by the Audit Committee.
| | | | | | | | |
| 2022 | 2021 |
Audit fees(1) | $ | 2.6 | | $ | 3.0 | |
| Audit-related fees | — | | — | |
| Tax fees | 0.1 | | — | |
| Total fees | $ | 2.7 | | $ | 3.0 | |
(1)Reflects fees for professional services performed by Ernst & Young for annual audits (including out-of-pocket expenses) and quarterly limited reviews of our consolidated financial statements.
Pre-Approval of Services Performed by the Independent Registered Public Accounting Firm
The Audit Committee has adopted procedures for pre-approving all audit and non-audit services provided by the independent registered public accounting firm. For both types of pre-approval, the Audit Committee considers whether the services are consistent with the Securities and Exchange Commission (“SEC”) rules on auditor independence and whether the independent registered public accounting firm is able to provide the most effective service. Audit and non-
PROXY STATEMENT FOR 2023 ANNUAL MEETING 63
RATIFICATION OF APPOINTMENT OF INDEPENDENT AUDITORS
audit fees to be incurred by the independent registered public accounting firm for services permitted by the Sarbanes-Oxley Act of 2002 to be performed by such firm must be approved in advance by the Audit Committee Chair or another designated member of the Audit Committee for individual projects in amounts up to $150,000 or the Audit Committee, and the Audit Committee must approve all such services for individual project in amounts greater than $150,000. The Audit Committee periodically monitors the services rendered and actual fees paid to the independent registered public accounting firm to ensure the services are within the parameters approved by the Audit Committee.
Report of the Audit Committee
Committee Composition and Skills
The Audit Committee is composed of three independent directors meeting the requirements of applicable SEC and New York Stock Exchange (“NYSE”) rules. The Board has determined all Audit Committee members are “financially literate” for purposes of the NYSE Listed Company Manual (the “NYSE Manual”) and select members qualify as audit committee “financial experts” within the meaning of the rules and regulations of the SEC. See “Proposal One - Election of Ten Directors — The Board of Directors” for a description of the business background of each member. No member of the Audit Committee serves on the audit committee of more than three public companies.
Meetings
The Audit Committee met 13 times during fiscal 2022, including 8 times by video/teleconference. Meetings include periodic executive sessions with the independent registered public accounting firm, internal auditors and management.
Responsibilities of the Audit Committee, Management and the Independent Auditor
The Audit Committee’s key responsibilities are set forth in its charter, which was approved by the Board and is available on our website at www.muellerwaterproducts.com. See “Corporate Governance — Board Operations — Board Committee Information” for more information concerning the Audit Committee and its responsibilities. With respect to the Company's consolidated financial statements for fiscal 2022 and internal control over financial reporting:
•Management was responsible for preparing the financial statements and establishing and maintaining effective internal control over financial reporting. The Audit Committee was responsible for monitoring and overseeing the financial reporting and audit functions, as well as the internal control over financial reporting and disclosure.
•EY, the independent registered public accounting firm, for fiscal 2022, was responsible for performing an independent audit of the Company’s consolidated financial statements and expressing an opinion on the conformity of those financial statements with accounting principles generally accepted in the United States and was also responsible for performing an independent audit of, and expressing an opinion on, the Company’s internal control over financial reporting.
•The Audit Committee reviewed and discussed with management and EY the audited consolidated financial statements for the year ended September 30, 2022, the quarterly consolidated financial statements and operating results for each quarter in the fiscal year and the related significant accounting and disclosure issues, the Critical Audit Matters (“CAMs”) and the effectiveness of internal control over financial reporting.
•The Audit Committee reviewed management’s report contained in the annual report on Form 10-K for the year ended September 30, 2022 (“Annual Report”), as well as EY’s Reports of the Independent Registered Public Accounting Firm included in the Annual Report related to its audits of the consolidated financial statements and internal control over financial reporting.
•The Audit Committee discussed with EY matters required to be discussed by the applicable requirements of the Public Company Accounting Oversight Board and the SEC. In addition, EY provided the Audit Committee with the written disclosures and the letter required by the applicable requirements of the Public Company Accounting Oversight Board regarding EY’s communications with the Audit Committee concerning independence and the Audit Committee has discussed with EY the firm’s independence.
64 MUELLER WATER PRODUCTS, INC.
RATIFICATION OF APPOINTMENT OF INDEPENDENT AUDITORS
Audited Consolidated Financial Statements
Based on the foregoing discussions with and reports of management and the independent registered public accounting firm and the Audit Committee’s review of the representations of management, the Audit Committee recommended to the Board the inclusion of the consolidated financial statements in the Annual Report.
| | | | | |
(3)
| Welfare benefits are continued for up to 24 months for Mr. Hall and 18 months for other NEOs from the separation date based on the current elections and plan premiums.Audit Committee |
| STEPHEN C. VAN ARSDELL, CHAIR |
| BERNARD G. RETHORE |
(4) | Services in Case A will be reasonable in our sole discretion. Services in Case B will be provided for up to two years, but will not exceed 35% of the NEO’s base salary at the time of termination.JEFFERY S. SHARRITTS |
| |
(5) | The change-in-control agreements for Messrs. Hart and Rogowski and Ms. Zakas contain a tax gross-up provision, which require the Company to pay any excise taxes imposed on payments received under their agreements. For purposes of this calculation, the gross-up would have been calculated by determining whether the total amount payable to the executive contingent upon a change-in-control exceeded 2.99 times the average of the annual eligible compensation payable to the executive during the preceding five years. If the total amount payable exceeded the average annual compensation amount, a gross up amount would have been added to the amounts otherwise payable to the executive in order to put the executive in the same after-tax position as if he or she had not been subject to the excise tax. The change-in-control agreements for Messrs. Hall and Belknap contain a “best-of-net” provision, so that, in the event excise taxes would be imposed on payments under the agreements, the executive will either (1) pay the excise tax without assistance from the Company or (2) have the payments reduced to an amount at which an excise tax would no longer be payable, based on which result is more favorable to the executive on an after-tax basis. |
| |
(6) | Cash severance is equal to a percentage of current annual base salary plus accrued vacation. The percentage applicable to Mr. Hall is 300%. The percentage applicable to Messrs. Hart and Rogowski is 262.5%. The percentage applicable to Mr. Belknap is 240%. The percentage applicable to Ms. Zakas is 225%. Other severance benefits are paid in monthly installments over 24 months in the case of Mr. Hall and over 18 months in the case of each other NEO, together with a lump sum payment of unpaid salary and other benefits. |
| |
(7) | Cash severance for Messrs. Hall, Hart and Rogowski and Ms. Zakas is equal to two times annual base salary plus two times the average bonus over the last three years, plus accrued vacation. Cash severance for Mr. Belknap is equal to two times annual base salary plus one and one-half times the average bonus over the last three years, plus accrued vacation. Accrued vacation assumes no vacation has been taken. |
BENEFICIAL OWNERSHIP OF COMMON STOCK
The following table lists information as of December 7, 2017 about12, 2022 regarding the number of shares of Common Stock beneficially owned by each incumbent director, each NEO, all of our directors and current executive officers as a group, and each person or group known by us to own more than 5% of our Common Stock. Unless otherwise noted, voting power and investment power in Common Stock are exercisable solely by the named person.
At December 7, 2017,12, 2022, there were 158,540,171156,195,499 shares of Common Stock outstanding.
| | | | | | | | | | | |
Name and Address of Beneficial Owner(1) | Aggregate Number of Shares of Common Stock Beneficially Owned(2) | Percent of Outstanding Common Stock |
Shirley C. Franklin Director | 65,601 | | (3) | * |
Scott Hall Director, President and Chief Executive Officer | 632,353 | | | * |
Thomas J. Hansen Director | 111,360 | | (3) | * |
Mark J. O’Brien Non-Executive Chair | 200,668 | | (3) | * |
Christine Ortiz Director | 35,232 | | (3) | * |
Bernard G. Rethore Director | 196,832 | | (3) | * |
Jeffery S. Sharritts Director | 15,301 | | (3) | * |
Brian L. Slobodow Director | — | | (3) | |
Lydia W. Thomas Director | 144,890 | | (3) | * |
Michael T. Tokarz Director | 405,771 | | (3) | * |
Stephen C. Van Arsdell Director | 62,336 | | (3) | * |
Marietta Edmunds Zakas Executive Vice President and Chief Financial Officer | 447,004 | | | * |
Steven S. Heinrichs Executive Vice President, Chief Legal and Compliance Officer and Secretary | 120,815 | | | * |
Todd P. Helms Senior Vice President and Chief Human Resources Officer | 64,582 | | | * |
Kenji Takeuchi Senior Vice President, Water Management Solutions | 51,698 | | | * |
| All directors and executive officers as a group (19 individuals) | 2,687,571 | | | 1.7 | % |
The Vanguard Group, Inc.
100 Vanguard Boulevard, Malvern, PA 19355 | 14,378,750 | | (4) | 9.2 | % |
Impax Asset Management Group plc, et al.
7th Floor, 30 Panton Street, London, SW1Y 4AJ | 12,768,256 | | (5) | 8.2 | % |
66 MUELLER WATER PRODUCTS, INC.
BENEFICIAL OWNERSHIP OF COMMON STOCK
|
| | | | | |
Name and Address of Beneficial Owner (1) | Aggregate Number of Shares of Common Stock Beneficially Owned (2) | Percent of Outstanding Common Stock |
| Shirley C. Franklin, Director | 119,965 |
| (3) | * |
|
| Scott Hall, President and Chief Executive Officer | 75,081 |
| (4) | * |
|
| Thomas J. Hansen, Director | 106,972 |
| (3) | * |
|
| Gregory E. Hyland, Executive Chairman | 1,600,501 |
| (5) | 1.0 | % |
| Jerry W. Kolb, Director | 159,777 |
| (3) | * |
|
| Mark J. O’Brien, Director | 176,566 |
| (3) | * |
|
| Bernard G. Rethore, Director | 146,470 |
| (3) | * |
|
| Lydia W. Thomas, Director | 161,227 |
| (3) | * |
|
| Michael T. Tokarz, Director | 520,276 |
| (3) | * |
|
| Evan L. Hart, Senior Vice President and Chief Financial Officer | 271,436 |
| | * |
|
| Keith L. Belknap, Executive Vice President, Business Development, General Counsel and Chief Compliance Officer | 207,920 |
| | * |
|
| Gregory S. Rogowski, Executive Vice President, Sales and Marketing | 538,195 |
| | * |
|
Marietta Edmunds Zakas Executive Vice President, Strategy, Corporate Development and Communications | 380,876 |
| | * |
|
| All directors and executive officers as a group (16 individuals) | 4,827,957 |
| | 3.0 | % |
Vanguard Group Inc. PO Box 2600, V26, Valley Forge, PA 19482-2600 | 11,632,394 |
| (6) | 7.3 | % |
BlackRock, Inc. 55 East 52nd Street, New York, NY 10055 | 10,465,831 |
| (7) | 6.6 | % |
EARNEST Partners, LLC 1180 Peachtree Street, NE, Suite 2300, Atlanta, GA 30309 | 8,136,500 |
| (8) | 5.1 | % |
| | | | | | | | | | | |
Name and Address of Beneficial Owner(1) | Aggregate Number of Shares of Common Stock Beneficially Owned(2) | Percent of Outstanding Common Stock |
BlackRock, Inc.
55 East 52nd Street, New York, NY 10055 | 12,706,693 | | (6) | 8.1 | % |
Nuance Investments, LLC
4900 Main Street, Suite 220, Kansas City, MO 64112 | 11,428,817 | | (7) | 7.3 | % |
T. Rowe Price Associates, Inc.
100 E. Pratt Street, Baltimore, MD 21202 | 8,369,160 | | (8) | 5.4 | % |
*Less than 1% of outstanding common stock
| |
(1) | The address of each of our directors and executive officers is c/o Mueller Water Products, Inc., 1200 Abernathy Road, N.E., Suite 1200, Atlanta, Georgia 30328. |
| |
(2) | Beneficial ownership as reported in the table has been determined in accordance with the rules of the SEC. Under those rules, a person is deemed to be a “beneficial owner” of a security if that person has or shares “voting power,” which includes the power to vote or to direct the voting of such security, or “investment power,” which includes the power to dispose of, or to direct the disposition of, such security. The person is also deemed to be a beneficial owner of any security of which that person has a right to acquire beneficial ownership within 60 days. Under such rules, more than one person may be deemed to be a beneficial owner of the same securities, and a person may be deemed to be a beneficial owner of securities as to which he or she may disclaim any beneficial interest. Except as indicated in other notes to this table, directors and executive officers possessed sole voting and investment power with respect to all shares of Common Stock referred to in the table. See “Executive Compensation — Outstanding Equity Awards at Fiscal Year-End Table” for more information concerning outstanding equity awards to our NEOs and “Director Compensation — Director Compensation Summary” for more information concerning outstanding equity awards to our directors. |
| |
(3) | Each non-employee director is “retirement-eligible” under and for purposes of the 2006 Stock Plan. Accordingly, for purposes of this table, all outstanding equity-based awards are deemed vested. Beginning with the equity-based awards granted to directors in January 2014, all such awards to directors require a grantee who is or becomes retirement-eligible prior to an initial vesting date to remain in continuous service from the grant date through at least the first anniversary thereof to receive accelerated vesting upon retirement. The beneficial ownership reported in the table assumes each grantee of an award on January 25, 2017 will remain in continuous service through January 25, 2018. |
| |
(4) | Includes 75,081 RSUs that will vest within 60 days. |
| |
(5) | Includes 85,812 RSUs that are subject to accelerated vesting upon retirement. |
| |
(6) | As reported on Schedule 13G/A filed with the SEC on February 10, 2017, Vanguard Group, Inc. has sole investment discretion with respect to 11,632,394 shares and sole voting power with respect to 310,655 shares. |
| |
(7) | As reported on Schedule 13G/A filed with the SEC on January 25, 2017, Blackrock, Inc. has sole investment discretion of 10,465,831 shares and sole voting power with respect to 9,926,566 shares. |
| |
(8) | As reported on Schedule 13G/A filed with the SEC on July 7, 2017, EARNEST Partners, LLC has sole investment discretion with respect to 8,136,500 shares and sole voting power with respect to 2,188,924. |
(1)The address of each of our directors and executive officers is c/o Mueller Water Products, Inc., 1200 Abernathy Road, N.E., Suite 1200, Atlanta, Georgia 30328.
(2)Beneficial ownership as reported in the table has been determined in accordance with the rules of the SEC. Under those rules, a person is deemed to be a “beneficial owner” of a security if that person has or shares “voting power,” which includes the power to vote or to direct the voting of such security, or “investment power,” which includes the power to dispose of, or to direct the disposition of, such security. The person is also deemed to be a beneficial owner of any security of which that person has a right to acquire beneficial ownership within 60 days. Under such rules, more than one person may be deemed to be a beneficial owner of the same securities, and a person may be deemed to be a beneficial owner of securities as to which he or she may disclaim any beneficial interest. Except as indicated in other notes to this table, directors and executive officers possessed sole voting and investment power with respect to all shares of Common Stock referred to in the table. See “Executive Compensation — Outstanding Equity Awards at Fiscal Year-End Table” for more information concerning outstanding equity awards to our NEOs and “Director Compensation — Director Compensation Summary” for more information concerning outstanding equity awards to our directors.
(3)Each non-employee director, with the exception of Dr. Ortiz and Messrs. Sharritts and Slobodow, is “retirement-eligible” under and for purposes of the Stock Plan. Accordingly, for purposes of this table, all outstanding equity-based awards for the retirement eligible non-employee directors are deemed vested. Beginning with the equity-based awards granted to directors in January 2014, all such awards to directors require a grantee who is or becomes retirement-eligible prior to an initial vesting date to remain in continuous service from the grant date through at least the first anniversary thereof to receive accelerated vesting upon retirement. The beneficial ownership reported in the table assumes each grantee of an award on February 7, 2022 will remain in continuous service through February 7, 2023 and/or all awards granted on February 7, 2022 will vest on or before February 7, 2023. Excludes Mr. Tokarz's 208,107 stock equivalent shares of Common Stock, which settle in cash in accordance with the Directors' Deferred Fee Plan.
(4)As reported on Schedule 13G/A filed with the SEC on February 10, 2022, The Vanguard Group, Inc. has sole investment discretion with respect to 14,103,557 shares, shared voting power with respect to 142,134 shares and shared investment discretion with respect to 275,193 shares.
(5)As reported on Schedule 13G filed with the SEC on February 14, 2022, Impax Asset Management Group plc and Impax Asset Management Limited each have sole investment discretion and sole voting power with respect to 12,768,256 shares.
(6)As reported on Schedule 13G/A filed with the SEC on February 3, 2022, BlackRock, Inc. has sole investment discretion with respect to 12,706,693 shares and sole voting power with respect to 12,410,514 shares.
(7)As reported on Schedule 13F-HR filed with the SEC on November 10, 2022 to report beneficial ownership of shares of the Company’s common stock as of September 30, 2022, and as confirmed by Nuance Investments, LLC, Nuance Investments, LLC has sole investment discretion and sole voting power with respect to 11,428,817 shares.
(8)As reported on Schedule 13G filed with the SEC on February 14, 2022, T. Rowe Price Associates, Inc. has sole investment discretion with respect to 8,369,160 shares and sole voting power with respect to 2,278,347 shares.
Delinquent Section 16(a) Reports
Section 16(a) of the Exchange Act requires executive officers and directors and persons who beneficially own more than 10% of a company’s common stock (together, “Reporting Persons”) to file initial reports of ownership and reports of changes in ownership with the SEC. Reporting Persons are required by SEC rules to furnish companies with copies of all Section 16(a) forms they file. Based solely on a review of copies of such forms furnished to us and written representations from the executive officers and directors, we believe our Reporting Persons complied with all Section 16 filing requirements during fiscal 2022, with the exception of (i) one amended Form 3 filing for Mr. Floyd in connection with previously unreported de minimis dividend reinvestments; (ii) one Form 5 filing for Mr. Floyd for fiscal 2020 and 2021 in connection with previously unreported de minimis dividend reinvestments; and (iii) one Form 4 filing for Todd Helms in connection with previously unreported de minimis dividend reinvestments as well as shares withheld to cover the tax liability on the lapse of restrictions on vested awards, which filing was made one business day late due to administrative error.
QUESTIONS ABOUT VOTING AND THE ANNUAL MEETING
When and where is the Annual Meeting?
OurThis year’s Annual Meeting will be heldconducted virtually on Wednesday, January 24, 2018February 7, 2023. You will be able to virtually (i) attend the Annual Meeting, (ii) vote your shares and (iii) submit questions during the meeting via live webcast by visiting www.meetnow.global/MLMGXU5.
To participate virtually at the Annual Meeting, you will need the voter control number included in your proxy materials or on your proxy card. We encourage you to allow ample time for online check-in as the meeting will begin promptly at 10:00 A.M.,a.m. Eastern Time,Time. Please note that there is no in-person meeting for you to attend.
The Annual Meeting will begin promptly at 10:00 a.m. Eastern Time. We encourage you to access the Annual Meeting prior to the start time to allow you ample time to log in to the live webcast and test your computer audio system. We recommend that you carefully review in advance the procedures needed to gain admission virtually to the Annual Meeting. The virtual meeting platform is fully supported across browsers (Microsoft Edge, Firefox, Chrome and Safari) and devices (desktops, laptops, tablets and cell phones) running the most up-to-date version of applicable software and plug-ins. Note: Internet Explorer is not a supported browser. Participants should ensure that they have a strong internet connection wherever they intend to participate in the Peachtree Dunwoody Room onmeeting. If you encounter any technical difficulties, technical support, including related technical support phone numbers, will be available in the 3rd Floor of Building 500 at Northpark Town Center, located at 1100 Abernathy Road, N.E., in Atlanta, Georgia.virtual meeting platform.
What is the purpose of the Annual Meeting?
At the Annual Meeting, stockholders will vote virtually on matters summarized in this Proxy Statement. This Proxy Statement contains important information for you to consider when deciding how to vote.
Who is entitled to vote?
You may vote virtually at the Annual Meeting, and any adjournment or postponement thereof, if you were a holder of record of our Common Stock at the close of business on December 7, 2017,12, 2022, the record date. On the record date, there were 158,540,171156,195,499 shares of Common Stock outstanding. Each share of Common Stock represented at the Annual Meeting is entitled to one vote.
Who is soliciting my vote?
The Board is soliciting your proxy to vote your shares at the Annual Meeting. We made our proxy solicitation materials available to you on the Internet or, upon your request, we have delivered printed versions of these materials to you by mail, in connection with our solicitation of proxies.
What is included in the proxy materials?
The proxy materials for the Annual Meeting include the Notice of Internet Availability of Proxy Materials, this Proxy Statement and the Annual Report. If you requested printed versions by mail, these proxy materials also include the proxy card or voting instruction form for the Annual Meeting. These materials were first sent or made available to stockholders on or about December 14, 2017.19, 2022.
What proposals require my vote, what vote is required to approve each proposal, how will abstentions and broker non-votes be treated and how does the Board recommend I vote?
|
| | | | | | | | | | | | | |
| Voting Item | Voting Standard | Treatment of Abstentions & Broker Non-Votes | Board Recommendation |
| | | |
| Elect Directors | Majority of votes cast | Not counted as votes cast and, therefore, no effect | | FOR each director nominee |
68 MUELLER WATER PRODUCTS, INC.
QUESTIONS ABOUT VOTING AND THE ANNUAL MEETING
| | | | | | | | | | | | | | |
Voting Item | Voting Standard | Treatment of Abstentions & Broker Non-Votes | Board Recommendation |
Approve executive compensation
Executive Compensation | Majority of votes cast | Not counted as votes cast and, therefore, no effect | | FOR |
| Approve Frequency of Advisory Vote to Approve Executive Compensation | Majority of votes cast | Not counted as votes cast and, therefore, no effect | | ANNUALLY |
| Ratify Auditor Appointment | Majority of votes cast | N/A | | FOR |
Will any other business be conducted at the Annual Meeting?
Management is not aware of any items, other than those referred to in this Proxy Statement, that may properly come before the Annual Meeting.
How are proxies voted?
Shares represented by all valid proxies received on time will be voted as specified. If a valid proxy form is received and does not indicate specific choices, the shares will be voted in accordance with the Board’s recommendations. The Board has designated each of Scott Hall, Keith L. BelknapSteven S. Heinrichs and Kristi O. CrawfordChason Carroll as proxies for the Annual Meeting.
How may I vote?
If your shares are registered directly in your name with our transfer agent, you are a “registered stockholder.” Registered stockholders may vote by:
•Internet at the web address noted in the Notice of Internet Availability of Proxy Materials, proxy materials email or proxy card that you received (we(we encourage you to vote in this manner)manner);
•Telephone through the number noted in the proxy card that you received (if you received a proxy card);
•Signing and dating your proxy card (if you received a proxy card) and mailing it to the indicated address; or
Attending•Virtually attending the Annual Meeting and voting in person.your shares.
If your shares are registered in the name of your broker, bank or other agent, you are the “beneficial owner” of those shares and those shares are considered as held in “street name.” If you are a beneficial owner of shares registered in the name of your broker, bank or other agent, you should have received a proxy card and voting instructions with these proxy materials from that organization rather than directly from us. Simply complete and mail the proxy card to ensure that your vote is counted. You may be eligible to vote your shares electronically over the Internet or by telephone. A large number of banks and brokerage firms offer Internet and telephone voting. If your bank or brokerage account,firm does not offer Internet or telephone voting information, please complete and return your proxy card in the self-addressed, postage-paid envelope provided. To virtually vote at the Annual Meeting, you aremust first obtain a “beneficial stockholder”valid legal proxy from your broker, bank or other agent and you should referthen register in advance to virtually attend the Annual Meeting. Follow the instructions provided byfrom your broker or bank included with these proxy materials or contact your broker or bank to request a legal proxy form.
After obtaining a valid legal proxy from your broker, bank or other agent, to then register to virtually attend the Annual Meeting, you must e-mail to Computershare at legalproxy@computershare.com your name and e-mail address and either (a) the forwarded e-mail from your bank, brokeragebroker or other nominee regarding howcontaining your legal proxy or (b) an attached image of your legal proxy. Upon successful preregistration, a beneficial owner will receive a confirmation e-mail from Computershare confirming registration and providing a control number to vote your shares.enter the virtual meeting as a stockholder. See “How can I register for the Annual Meeting?” below for additional details.
If you plan to vote other than by virtually attending the Annual Meeting and voting in person,your shares, your vote must be received by 11:59 P.M.10:00 a.m., Eastern Time, on February 7, 2023.
How can I ask questions pertinent to meeting matters?
Stockholders may submit questions either before the annual meeting (beginning January 23, 2018.31, 2023) or during the Annual Meeting. If you wish to submit a question either before or during the meeting, please log into www.meetnow.global/MLMGXU5 and enter your 15-digit voter control number, then follow the instructions to submit a question. Questions pertinent to meeting matters will be answered during the meeting, subject to time limitations.
PROXY STATEMENT FOR 2023 ANNUAL MEETING 69
QUESTIONS ABOUT VOTING AND THE ANNUAL MEETING
How can I change my vote?
You can revoke a proxy prior to the completion of voting at the Annual Meeting by:
•Voting again using the Internet or by telephone prior to the Annual Meeting;
•Delivering a later-dated proxy card; or
•Voting in personyour shares virtually at the meeting (if you are a beneficial stockholder).
What constitutes a quorum for the Annual Meeting?
The holders of a majority of the voting power of the outstanding shares of Common Stock at the close of business on the record date must be present, either in personpersonally or represented by proxy, to constitute a quorum necessary to conduct the Annual Meeting. Shares represented by proxies received but marked as abstentions or as withholding voting authority for any or all director nominees, and shares represented by proxies received but reflecting broker non-votes, will be counted as present at the Annual Meeting for purposes of establishing a quorum.
Why did I receive a Notice of Internet Availability of Proxy Materials in the mail instead of a printed set of proxy materials?
We are permitted by SEC rules to furnish proxy materials to stockholders by providing access to those documents on the Internet. Stockholders will not receive printed copies of the proxy materials unless they request them. The Notice provides instructions on how to access and review the Proxy Statement and the Annual Report over the Internet at www.proxyvote.com (for beneficial stockholders) and www.edocumentview.com/mwawww.envisionreports.com/MWA (for registered stockholders), and how to submit a proxy over the Internet. If you would like to receive a paper or email copy of the proxy materials, please follow the instructions in the Notice.
What does it mean if I receive more than one Notice, proxy materials email or proxy card?
It means you have multiple accounts holding Common Stock with brokers and/or our transfer agent. You will need to vote separately with respect to each Notice, proxy materials email or proxy card you receive.
What do I need to do if I want to attend the Annual Meeting?
Attendance atThe Annual Meeting will be a completely virtual meeting of stockholders, which will be conducted exclusively by webcast. You are entitled to participate in the Annual Meeting only if you were a stockholder of the Company as of the close of business on the Record Date or if you hold a valid proxy for the Annual Meeting. There is limited to our stockholders, members of their immediate families or their representatives. To gain admittance tono physical location for this meeting.
You can attend the Annual Meeting online, vote and submit questions pertinent to meeting matters during the meeting by visiting www.meetnow.global/MLMGXU5. Please follow the registration instructions below.
The Annual Meeting will begin promptly at 10:00 a.m., Eastern Time, on February 7, 2023. We encourage you may be required to show evidence thataccess the meeting prior to the start time in order to log in to the live webcast and test your computer audio system.
How can I register for the Annual Meeting?
If you wereare a holder of Common Stock on the record date. We reserve the rightregistered stockholder (i.e., you hold your shares through our transfer agent, Computershare), you do not need to limit the number of representatives who mayregister to attend the Annual Meeting.Meeting virtually on the Internet. Please follow the instructions on the Proxy Card or Notice that you received with this Proxy Statement. To access the meeting, you will need the 15-digit control number printed on your card or notice.
If you are a beneficial owner (i.e., you hold your shares through an intermediary, such as a bank or broker), you must register in advance to attend the Annual Meeting virtually on the Internet. To register, you must submit a legal proxy that reflects your proof of proxy power. The legal proxy must reflect your Mueller Water Products, Inc. holdings along with your name. Please forward a copy of the legal proxy and your email address to Computershare either by email to legalproxy@computershare.com (forward the email from your broker or attach an image of your legal proxy) or by mail to Computershare, Mueller Water Products, Inc. Legal Proxy, P.O. Box 43001, Providence, RI 02940-3001.
70 MUELLER WATER PRODUCTS, INC.
QUESTIONS ABOUT VOTING AND THE ANNUAL MEETING
Requests for registration must be labeled as “Legal Proxy” and be received no later than 5:00 p.m., Eastern Time, on February 2, 2023. You will receive a confirmation of your registration by email (or by mail if no email address is provided) after Computershare receives your registration materials.
How are proxies solicited and what is the cost?
We bear all expenses incurred in connection with the solicitation of proxies. We have engaged Alliance Advisors LLCInnisfree M&A Incorporated to assist with the solicitation of proxies for an estimated fee of $10,000,$150,000, plus expenses. We will reimburse brokers, fiduciaries and custodians for their costs in forwarding proxy materials to beneficial holders of Common Stock. Our directors, officers and employees also may solicit proxies in return for no additional compensation.
How can I submit my proposal for inclusion in next year’s proxy?
SEC rules permit stockholders to submit proposals for inclusion in our proxy statement if the stockholder and the proposal meet the requirements specified in Rule 14a-8 under the Exchange Act.
•When to submit? Any stockholder proposals submitted in accordance with Rule 14a-8 must be received at our principal executive offices no later than August 21, 2023.
•Where to submit? Proposals should be addressed to Corporate Secretary, Mueller Water Products, Inc., 1200 Abernathy Road, N.E., Suite 1200, Atlanta, Georgia 30328.
•What to submit? Proposals must conform to and include the information required by Rule 14a-8.
We encourage stockholders to contact our Corporate Secretary prior to submitting a stockholder proposal or any time they have concerns about us.
How can I present a proposal for consideration at next year’s annual meeting?
Our Bylaws provide that any stockholder proposal, including director nominations, that is not submitted for inclusion in next year’s proxy statement under Rule 14a-8, but is instead sought to be presented directly at next year’s annual meeting of stockholders must be delivered to our principal executive offices not less than 90 days nor more than 120 days prior to the first anniversary of the date we commenced mailing these proxy materials.
•When to submit? Stockholder proposals submitted under these Bylaw provisions must be received no earlier than August 21, 2023 and no later than September 20, 2023.
•Where to submit? Proposals should be addressed to Corporate Secretary, Mueller Water Products, Inc., 1200 Abernathy Road, N.E., Suite 1200, Atlanta, Georgia 30328.
•What to submit? Proposals must include the information required by our Bylaws, which are available on our website. If the notice delivered to our Corporate Secretary does not contain all of the information specified in our Bylaws, the proposed business will not be transacted at the annual meeting.
By Order of the Board of Directors.
STEVEN S. HEINRICHS
Corporate Secretary
Atlanta, Georgia
December 19, 2022
GENERAL INFORMATION
Section 16(a) Beneficial Ownership Reporting Compliance
Section 16(a) of the Exchange Act requires executive officers and directors and persons who beneficially own more than 10% of a company’s common stock (together, “Reporting Persons”) to file initial reports of ownership and reports of changes in ownership with the SEC. Reporting Persons are required by SEC rules to furnish companies with copies of all Section 16(a) forms they file. Based solely on a review of copies of such forms furnished to us and written representations from the executive officers and directors, we believe our Reporting Persons complied with all Section 16 filing requirements during fiscal 2017.
Other Business for Presentation at the Annual Meeting
The Board and management do not intend to bring before the Annual Meeting any matters other than those disclosed in the Notice of Annual Meeting of Stockholders, nor do they know of any business that other persons intend to present virtually at the Annual Meeting. Should any other matter or business requiring a vote of stockholders arise, the persons named in the enclosed proxy intend to exercise the authority conferred by the proxy and vote the shares represented thereby in respect of any such other matter or business in accordance with their best judgment in the interest of Mueller Water Products, Inc.
Other Information
Consolidated financial statements for Mueller Water Products, Inc. are included in the 20172022 Annual Report filed with the SEC, 100 F Street, N.E., Washington, D.C. 20549, and the New York Stock Exchange. A copy of the 20172022 Annual Report (excluding exhibits) will be furnished, without charge, by writing to the Corporate Secretary, Mueller Water Products, Inc., 1200 Abernathy Road, N.E., Suite 1200, Atlanta, Georgia 30328. The 20172022 Annual Report is also available on the SEC’s website at www.sec.gov or on our website at www.muellerwaterproducts.com.
72 www.muellerwaterproducts.com.MUELLER WATER PRODUCTS, INC.
STOCKHOLDER INFORMATION
Stockholder Proposals for Inclusion in Next Year’s Proxy Statement
SEC rules permit stockholders to submit proposals for inclusion in our proxy statement if the stockholder and the proposal meet the requirements specified in Rule 14a-8 under the Exchange Act.
When to submit?
Any stockholder proposals submitted
EXHIBIT A - RECONCILIATION OF NON-GAAP PERFORMANCE MEASURES TO GAAP PERFORMANCE MEASURES
The Company presents adjusted net income, adjusted net income per diluted share, adjusted operating income, and adjusted EBITDA as performance measures because management uses these measures in evaluating the Company’s underlying performance on a consistent basis across periods and in making decisions about operational strategies. Management also believes these measures are frequently used by securities analysts, investors and other interested parties in the evaluation of the Company’s recurring performance. These are considered measures not calculated in accordance with Rule 14a-8 must be received at our principal executive offices no later than August 16, 2018.GAAP and are therefore considered non-GAAP measures. The Company provides the following reconciliations of these non-GAAP measures to their most comparable GAAP measures.
| | | | | | | | |
| Year Ended September 30, 2022 | |
| Reconciliation of Non-GAAP Performance Measures to GAAP Performance Measures (in millions) |
| Net income | $ | 76.6 | |
| Strategic reorganization and other charges | 7.2 | |
| Warranty Charge | | 4.5 | |
| Goodwill impairment | | 6.8 | |
| Income tax benefit of adjusting items | (4.1) | |
| Adjusted net income | $ | 91.0 | |
| |
| Weighted average diluted shares outstanding | 158.0 | |
| |
| Net income per diluted share | | $ | 0.48 | |
| Adjusted net income per diluted share | $ | 0.58 | |
| |
| Net income | $ | 76.6 | |
| Income tax expense | 22.0 | |
| Interest expense, net | 16.9 | |
| Pension benefit other than service | (3.9) | |
| Operating income | 111.6 | |
| Strategic reorganization and other charges | 7.2 | |
| Warranty Charge | | 4.5 | |
| Goodwill impairment | | 6.8 | |
| Adjusted operating income | 130.1 | |
| Pension benefit other than service | 3.9 | |
| Depreciation and amortization | 60.5 | |
| Adjusted EBITDA | $ | 194.5 | |
| | |
PROXY STATEMENT FOR 2023 ANNUAL MEETING 73
Proposals should be addressed to Corporate Secretary, Mueller Water Products, Inc., 1200 Abernathy Road, N.E., Atlanta, Georgia 30328.
Proposals must conform to and include the information required by Rule 14a-8.
We encourage stockholders to contact our Corporate Secretary prior to submitting a stockholder proposal or any time they have concerns about us.
Procedures for Business Matters and Director Nominations for Consideration at Next Year’s Annual Meeting of Stockholders
Our Bylaws provide that any stockholder proposal, including director nominations, that is not submitted for inclusion in next year’s proxy statement under Rule 14a-8, but is instead sought to be presented directly at next year’s annual meeting of stockholders must be delivered to our principal executive offices not less than 90 days nor more than 120 days prior to the first anniversary of the date we commenced mailing these proxy materials.
Stockholder proposals submitted under these Bylaw provisions must be received no earlier than August 16, 2018 and no later than September 15, 2018.
Proposals should be addressed to Corporate Secretary, Mueller Water Products, Inc., 1200 Abernathy Road, N.E., Atlanta, Georgia 30328.
What to submit? Proposals must include the information required by our Bylaws, which are available on our website. If the notice delivered to our Corporate Secretary does not contain all of the information specified in our Bylaws, the proposed business will not be transacted at the annual meeting.
By Order of the Board of Directors.
Keith L. Belknap
Corporate Secretary
Atlanta, Georgia
December 14, 2017
Exhibit A
| Reconciliation of Non-GAAP Performance Measures to GAAP Performance Measures |
| | | | | | | | | | | | | | | | | | | |
| 2017 |
| | GAAP | | Reporting Adjustments | | Adjusted Non-GAAP As Reported | | Singer Valve and Other | | Performance Evaluation Basis - Adjusted |
| (in millions) |
| Net sales | $ | 826.0 |
| | $ | — |
| | $ | 826.0 |
| | $ | (10.3 | ) | | $ | 815.7 |
|
| Cost of goods sold | 558.5 |
| | (10.8 | ) | | 547.7 |
| | (5.7 | ) | | 542.0 |
|
| Gross profit | 267.5 |
| | 10.8 |
| | 278.3 |
| | (4.6 | ) | | 273.7 |
|
| Selling, general and administrative expenses | 156.4 |
| | — |
| | 156.4 |
| | (4.0 | ) | | 152.4 |
|
| Other charges | 10.4 |
| | (10.4 | ) | | — |
| | — |
| | — |
|
| Operating income from continuing operations | 100.7 |
| | 21.2 |
| | 121.9 |
| | (0.6 | ) | | 121.3 |
|
| Interest expense, net | 22.2 |
| | — |
| | 22.2 |
| | — |
| | 22.2 |
|
| Income tax expense | 24.2 |
| | 4.3 |
| | 28.5 |
| | 2.1 |
| | 30.6 |
|
| Income from continuing operations | $ | 54.3 |
| | $ | 16.9 |
| | $ | 71.2 |
| | $ | (2.7 | ) | | $ | 68.5 |
|
| | | | | | | | | | |
| | | | | | | | | | |
| 2016 |
| | GAAP | | Reporting Adjustments | | Adjusted Non-GAAP As Reported | | Adjust to Performance Plan Tax Rate | | Performance Evaluation Basis - Adjusted |
| (in millions) |
| Net sales | $ | 800.6 |
| | $ | — |
| | $ | 800.6 |
| | $ | — |
| | $ | 800.6 |
|
| Cost of goods sold | 532.7 |
| | — |
| | 532.7 |
| | — |
| | 532.7 |
|
| Gross profit | 267.9 |
| | — |
| | 267.9 |
| | — |
| | 267.9 |
|
| Selling, general and administrative expenses | 151.2 |
| | — |
| | 151.2 |
| | — |
| | 151.2 |
|
| Pension settlement | 16.6 |
| | (16.6 | ) | | — |
| | — |
| | — |
|
| Other charges | 7.2 |
| | (7.2 | ) | | — |
| | — |
| | — |
|
| Operating income from continuing operations | 92.9 |
| | 23.8 |
| | 116.7 |
| | — |
| | 116.7 |
|
| Interest expense, net | 23.6 |
| | — |
| | 23.6 |
| | — |
| | 23.6 |
|
| Income tax expense | 24.2 |
| | 8.1 |
| | 32.3 |
| | 3.5 |
| | 35.8 |
|
| Income from continuing operations | $ | 45.1 |
| | $ | 15.7 |
| | $ | 60.8 |
| | $ | (3.5 | ) | | $ | 57.3 |
|